Impossible Cities
This paper outlines a design proposal for building car-free cities, circa 2020.
- Streets designed for mobility — better design choices
- This proposal hinges on a re-design of what a city street looks like, to try to get less congestion, twice the average travel speed, and twice the total throughput (compared to, say, Manhattan New York). See chapter 1.
- Mobility for prosperity, not for faster commutes
- The main goal of the new design is to increase urban mobility. However, non-intuitively, the benefit is not faster commutes, but is instead higher wages & more social opportunities, as well as higher land values & better investment return rates. See chapter 2.
- Beyond mobility — better cities & better outcomes
- The main goal is better mobility, but the design has a variety of other potential upsides. Cities like this should be greener, cleaner, fairer, safer, simpler, and more reliable & resilient. See chapter 3.
- This matters now
- This is an important area for study & discussion right now, because there’s about to be a huge influx of urban population, and a huge increase in urban construction. The construction of buildings will happen no matter what, so it would be good to try to do it in conjunction with the construction of modern transportation networks, rather than just repeating what was done in past decades. See chapter 4.
- This requires better funding models & better value capture agreements
- Construction is very expensive. In order to fund the huge amount of construction required for new transportation networks, we need to get much better at land value capture. We need to set up reliable “fiscal engines” that can robustly recover the value created on each development project and reinvest it quickly on the next project. See chapter 5.
Chapter 1 — Streets designed for mobility
The Impossible City proposal hinges on a basic redesign of what a city street could look like.
The Impossible design
- replaces cars & buses with bicycles & bike-sized vehicles
- replaces stop signs and traffic lights with grade-separated intersections
- replaces outdoor, ground-level streets with elevated, sheltered streets
The result is:
- less congestion and twice the throughput
- 50% annual cost savings over conventional public transit and private car ownership
- lower carbon emissions, quieter streets, and less air pollution
- more trees
- a bit more available floorspace
2nd Avenue, Manhattan |
Impossible Street Design |
|
| right-of-way | 100-foot wide right-of-way (including sidewalks & street) |
100-foot wide right-of-way (including sidewalks & pair of center buildings) |
| sidewalks | two 20-foot wide sidewalks | two 15-foot wide sidewalks at ground level two 25-foot wide “High Line“-style greenways with footpaths |
| streets | one 60-foot wide open-air street | two 30-foot wide enclosed streets elevated on 2nd floor |
| lanes | six conventional vehicle lanes all one-way southbound each lane 10 feet wide |
eight bicycle lanes 4 northbound & 4 southbound each lane 6 feet wide, plus two shoulders, each 3 feet wide |
| vehicles | 1 bus-only lane 4 lanes for cars, trucks, taxis, etc. 1 lane parking & curbside loading |
8 lanes for bicycles and bike-sized vehicles |
| cross-streets | about 20 per mile | 8 per mile |
| traffic lights | about 20 per mile | none |
| intersections | at-grade conventional intersections | grade-separated intersections |
| trees | about 150 per mile | about 200 per mile |
| speed limits as posted |
25 mph1 | 18 mph |
| actual speed average |
7.1 mph for cars2,3 7.5 mph for buses2 |
15 mph |
| vehicle throughput |
1 bus lane at about 6,000 people per hour (+/- 2,000) 4 car lanes at about 1,000 people per hour each (+/- 400) 1 parking & delivery lane at 0 people per hour total: about 11,000 people per hour |
8 bike lanes at about 3,500 people per hour per bike lane each (+/- 250 per hour) total: about 28,000 people per hour |
| sidewalk throughput |
about 10,000 people per hour | about 10,000 people per hour |
| bottom line | less than half as many people as Impossible City design each moving half as fast |
twice as many people as Manhattan each moving twice as fast |
| Costs | ||
| traffic fatalities | 23 fatalities per million people per year | 1 fatality per million per year |
| CO2 footprint for transportation kg per person per year |
1,000 kg | 1 kg |
| cost of public transit annual dollars per capita |
$360 in fares paid by riders $720 in city funded transit subsidies $1,080 total |
$0 |
| private vehicle costs annual dollars per capita |
$1,000 mostly for cars about 1 car per 10 people |
$1,000 mostly for bicycles, e-bikes, mopeds, scooters, etc. about 1 vehicle per person |
| air quality | good | really good |
| noise levels | noisier | quieter (see noise) |
| Land area & real estate | ||
| roads for cars | 17% of land area (2,450 total acres in Manhattan4) | |
| off-street parking for cars | 7% of land area (1,000 total acres in Manhattan4) | |
| floorspace | no real estate floorspace in street | 680,000 square feet of floor space per mile |
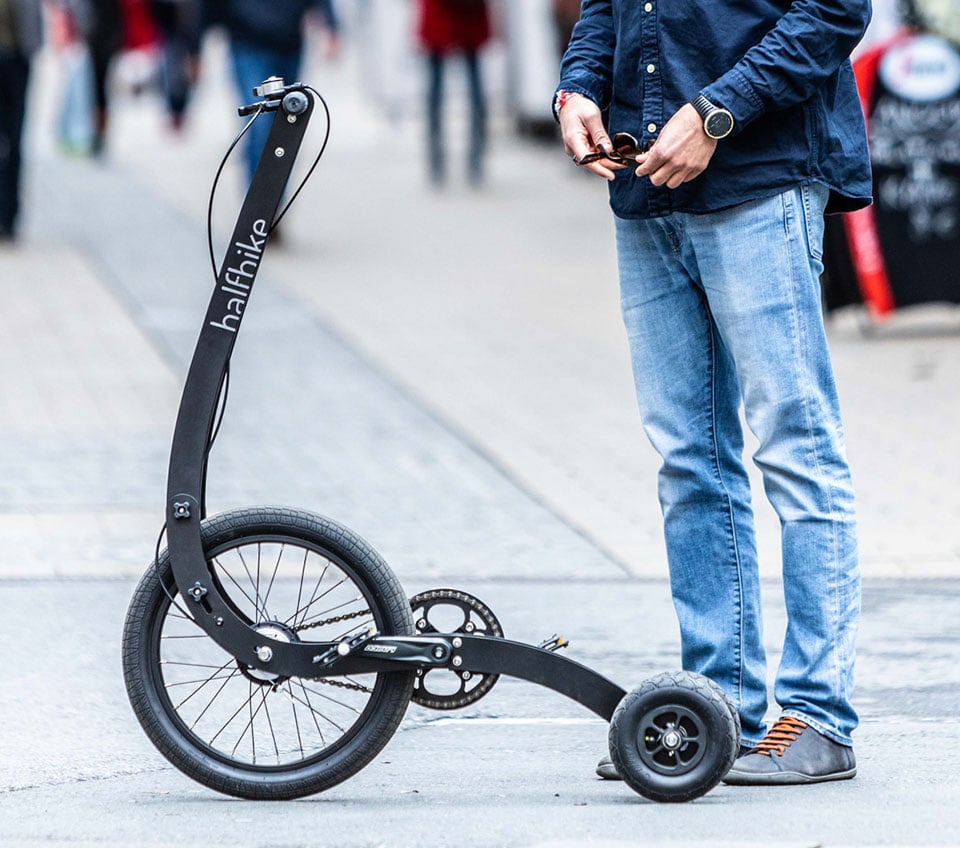
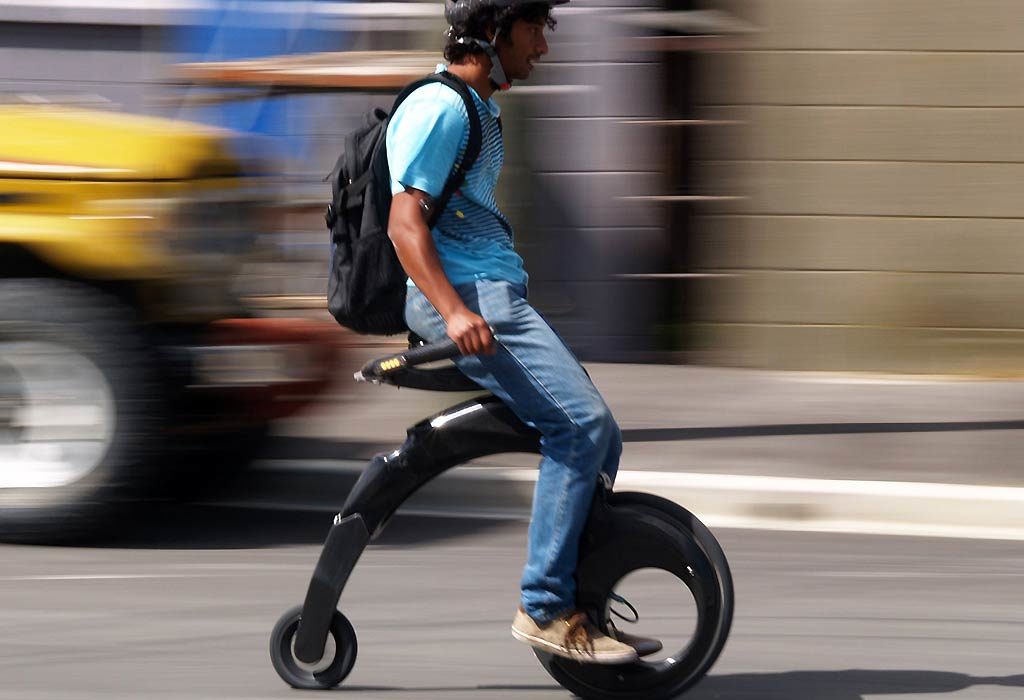
Bike-sized vehicles
The Impossible street design replaces cars & buses with a wide variety of different kinds of bicycles & bike-sized vehicles. For this design “bike-sized” means:
| limits for most vehicles | limits for licensed cargo vehicles | |
|---|---|---|
| narrow | 30 inch width limit | 48 inch width |
| lightweight | 111 pounds or less | 222 pounds |
| underpowered | 2 horsepower or lower | 4 horsepower |
| slow | 18 mph speed limit city-wide with automated enforcement |
15 mph |
| Examples | |
|---|---|
| (The copyright to these pictures belongs to their respective owners. The pictures are used here under fair use, and are not included as part of the Creative Commons Zero v1.0 Universal license/waiver that applies to the rest of this paper.) | |
| bicycles |   |
| family bicycles |  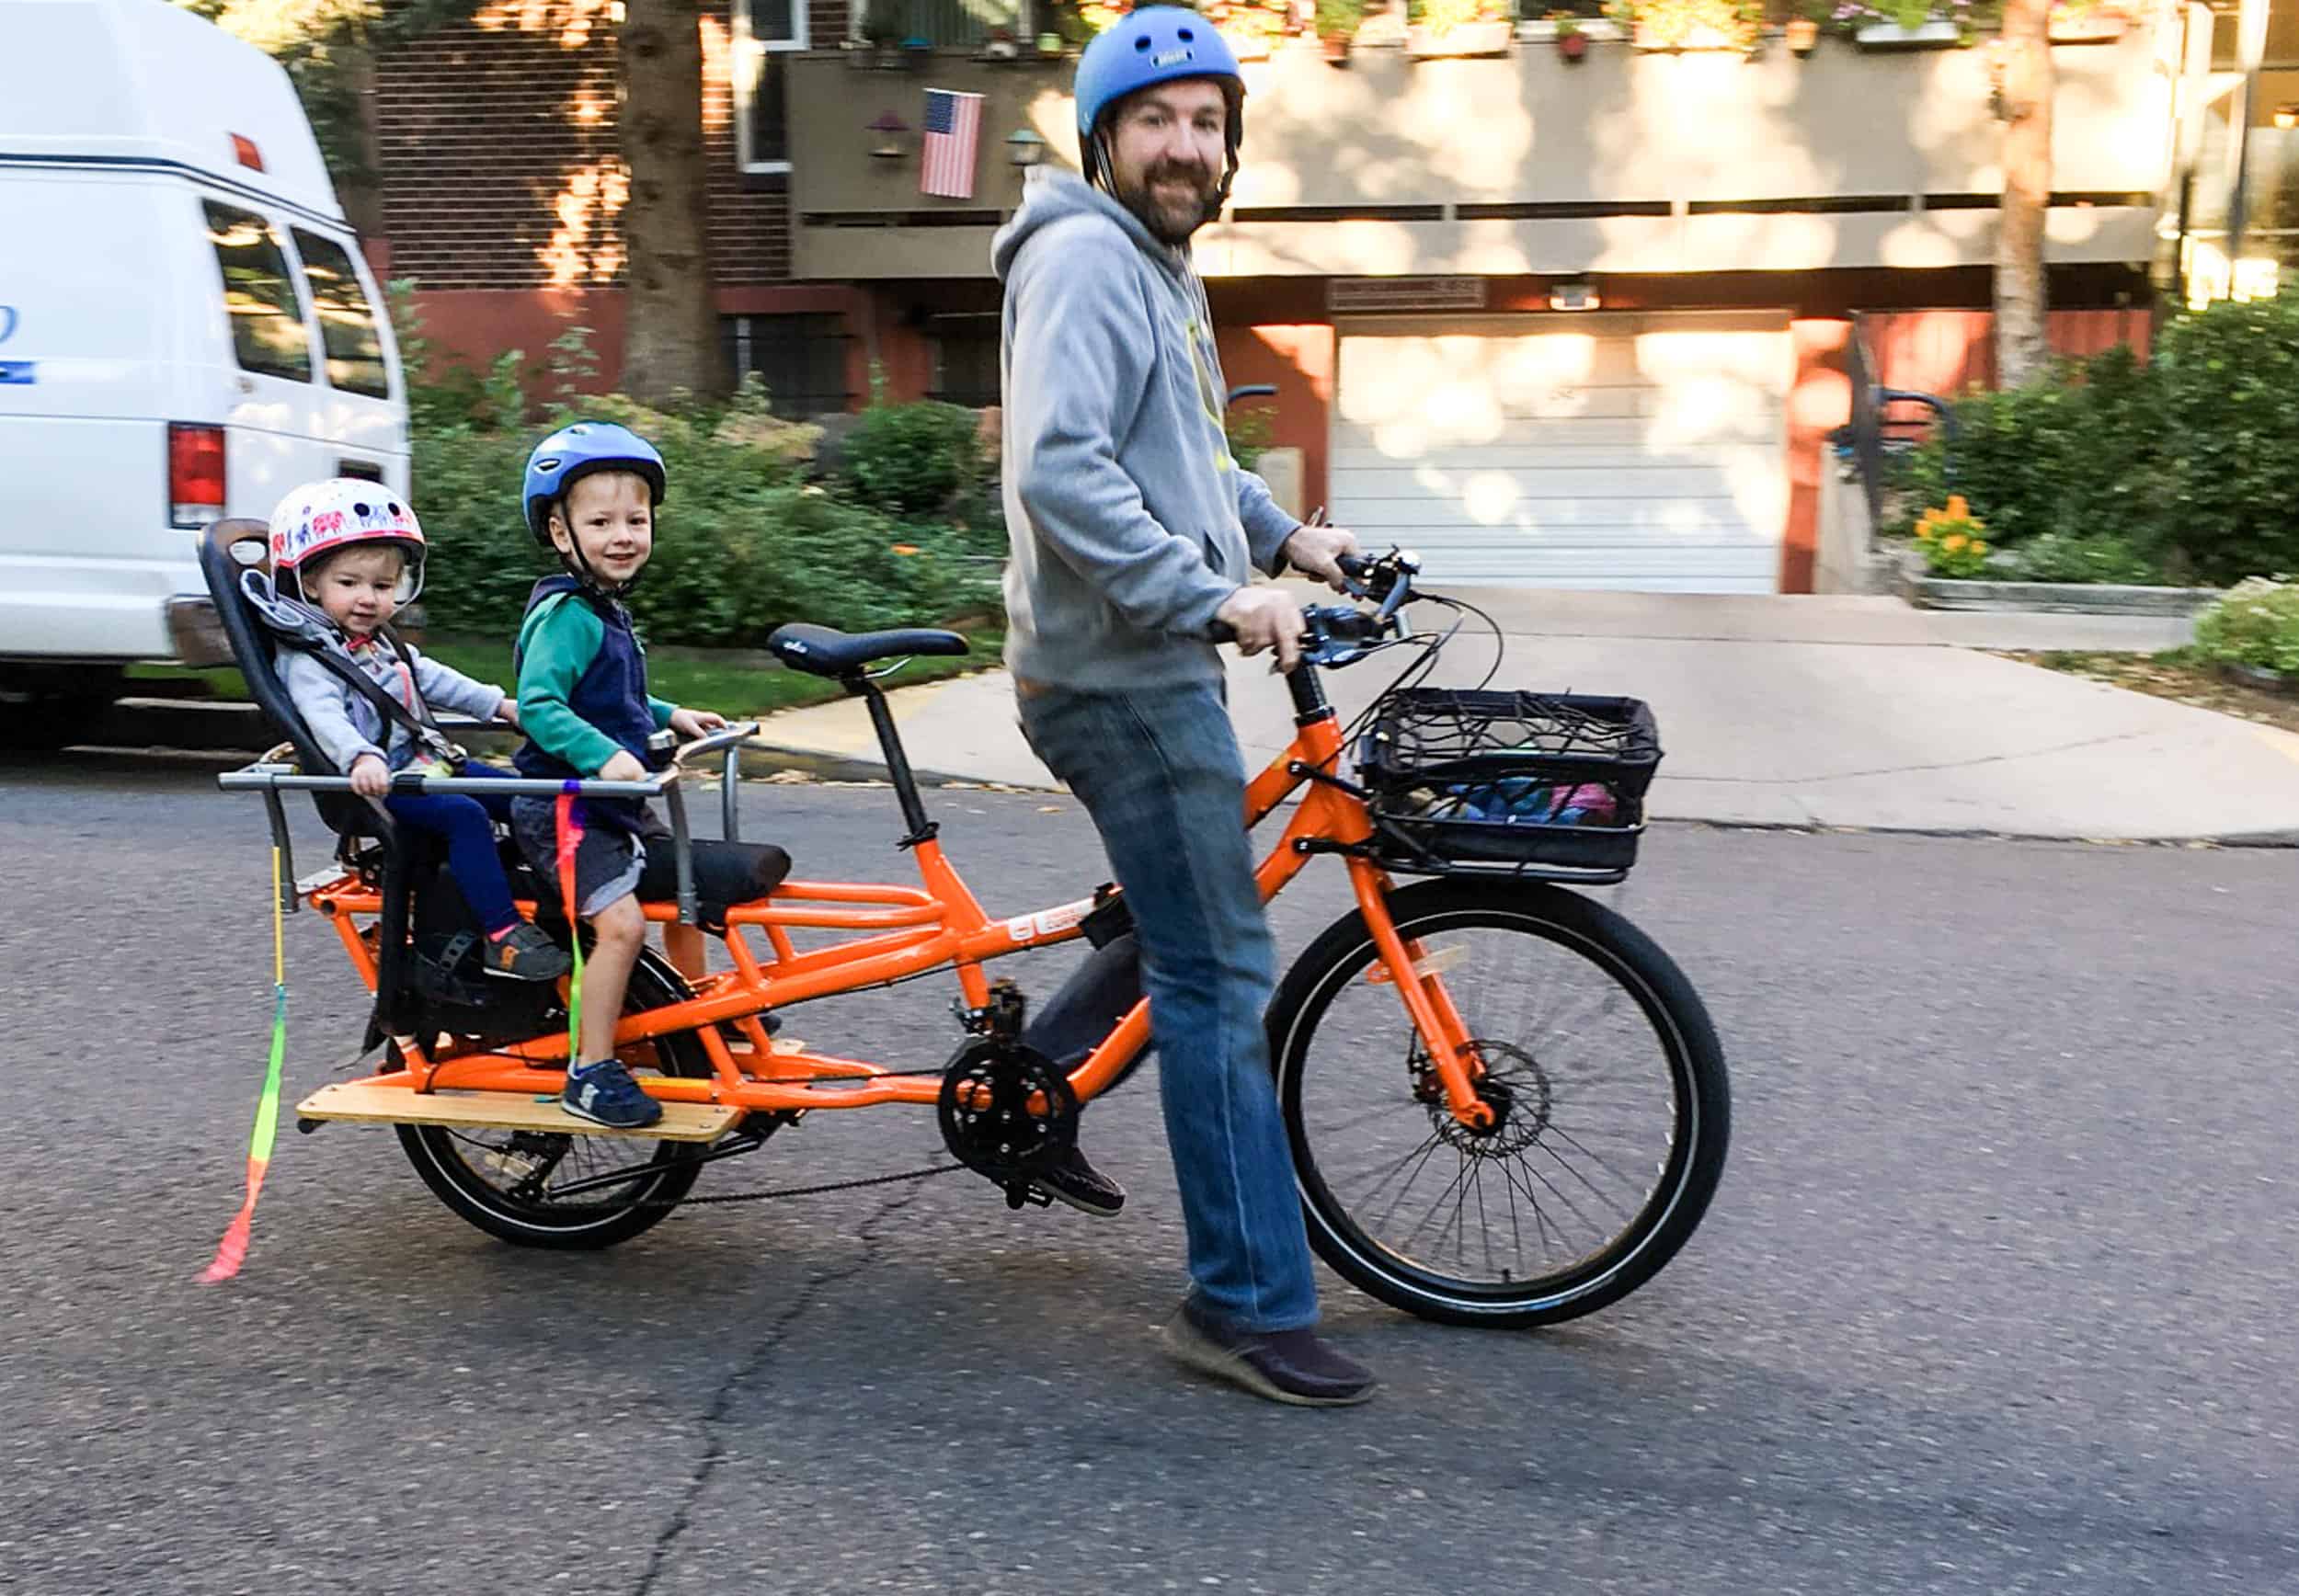  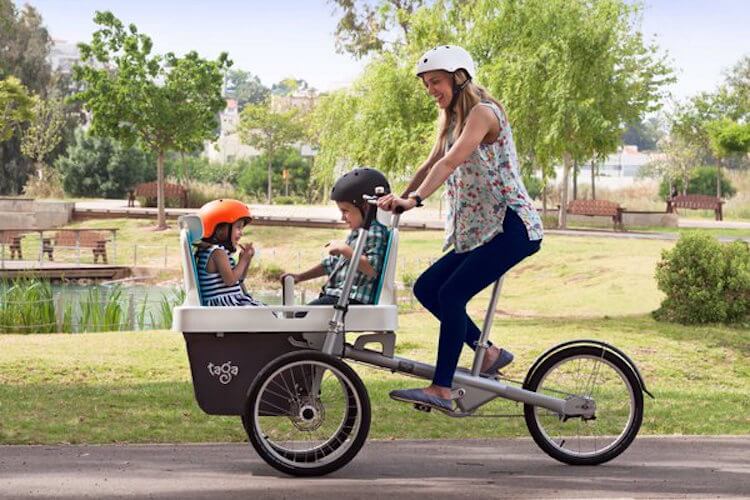 |
| folding bicycles & compact hybrids |
     |
| electric bicycles |   |
| mopeds & scooters (electric) |
  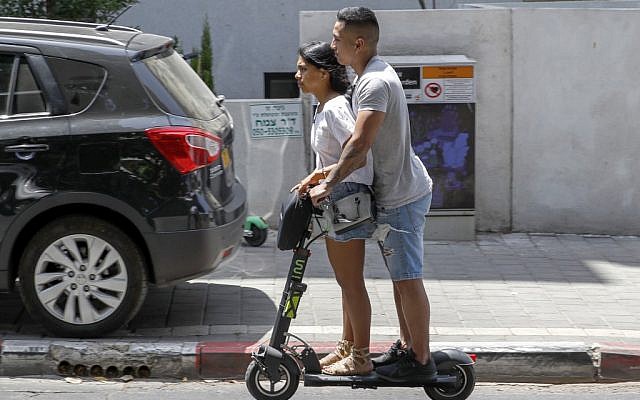   |
| passenger trikes |  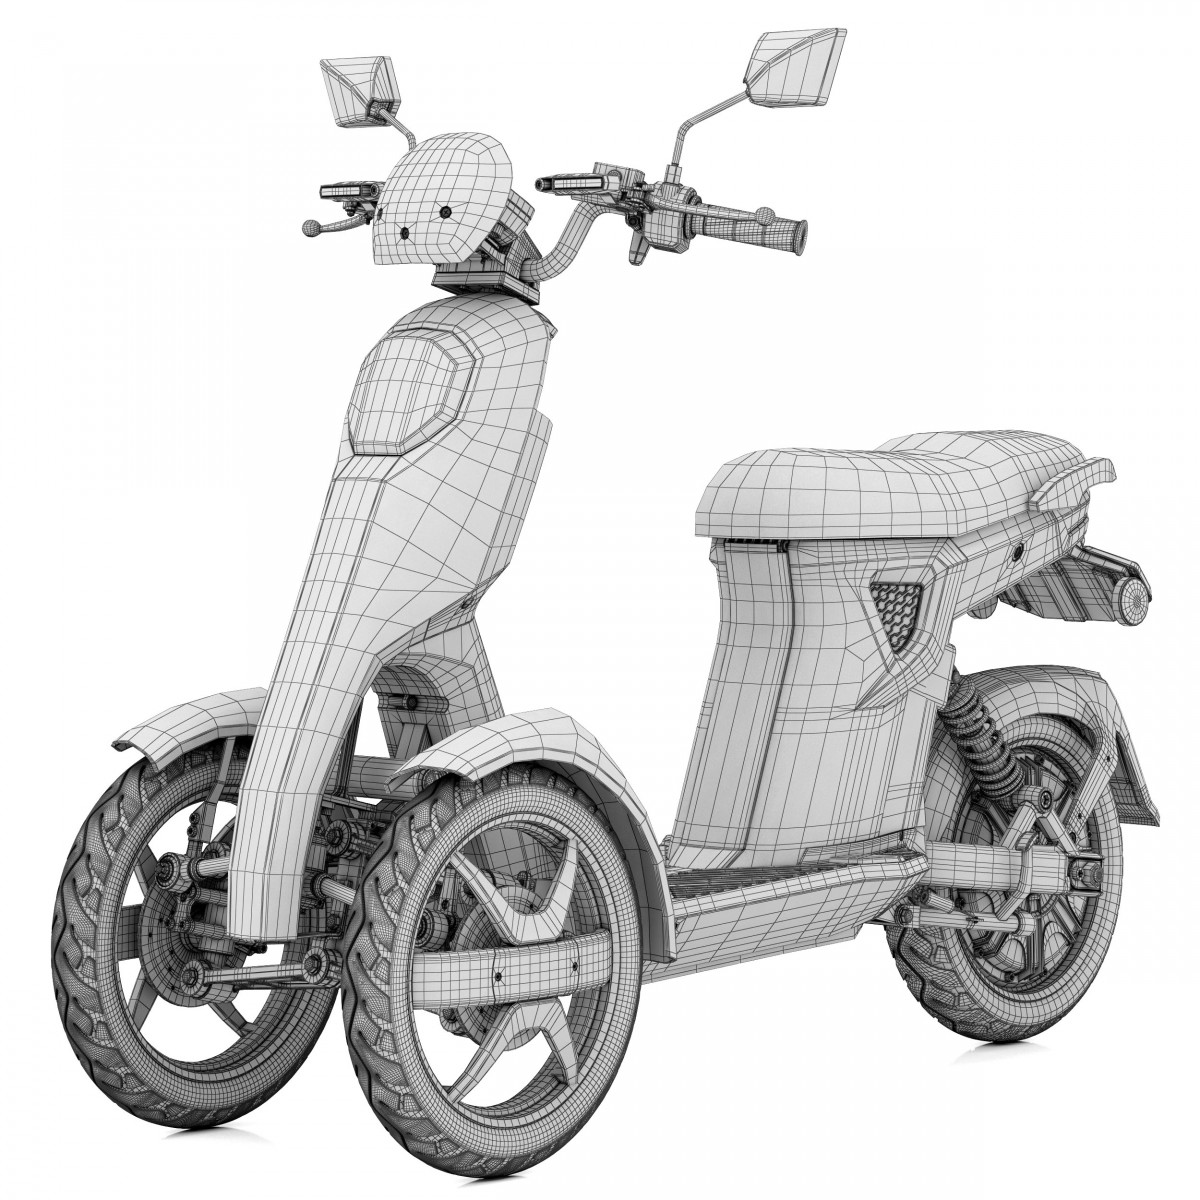   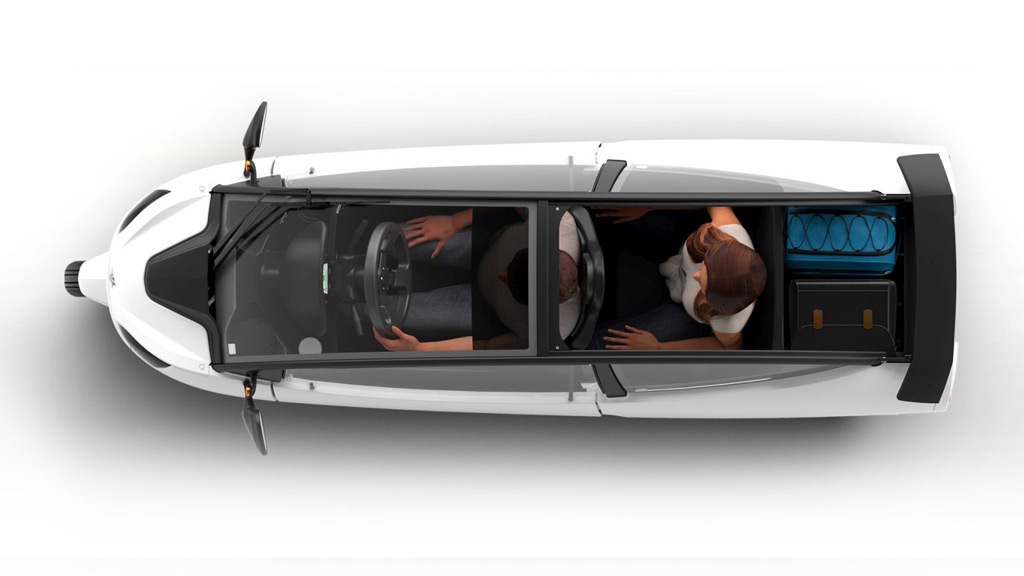  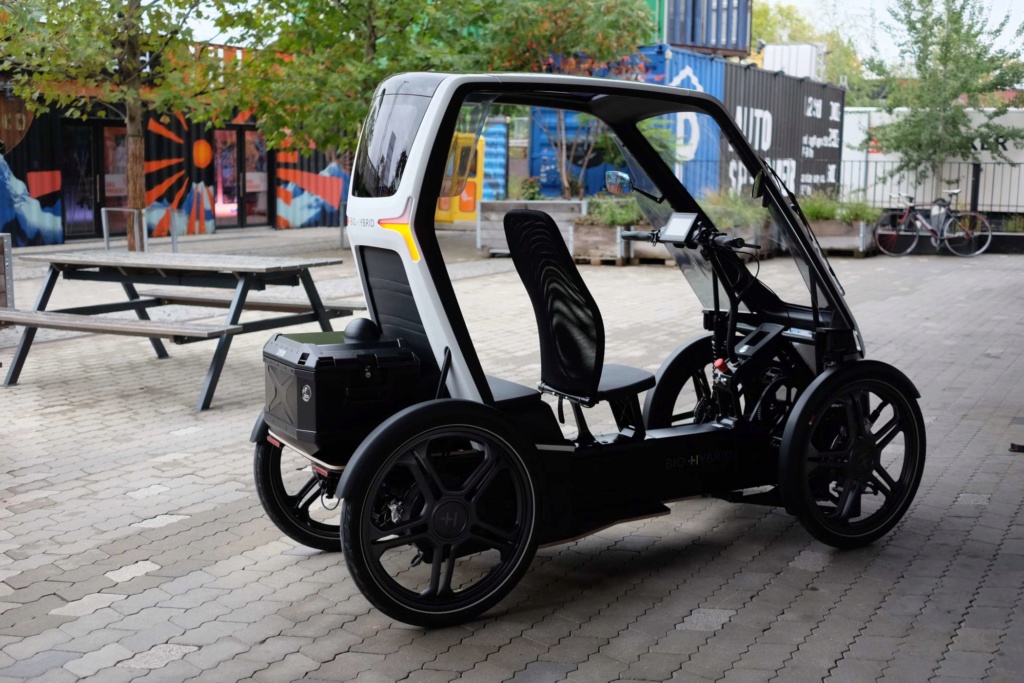 |
| cargo trikes | 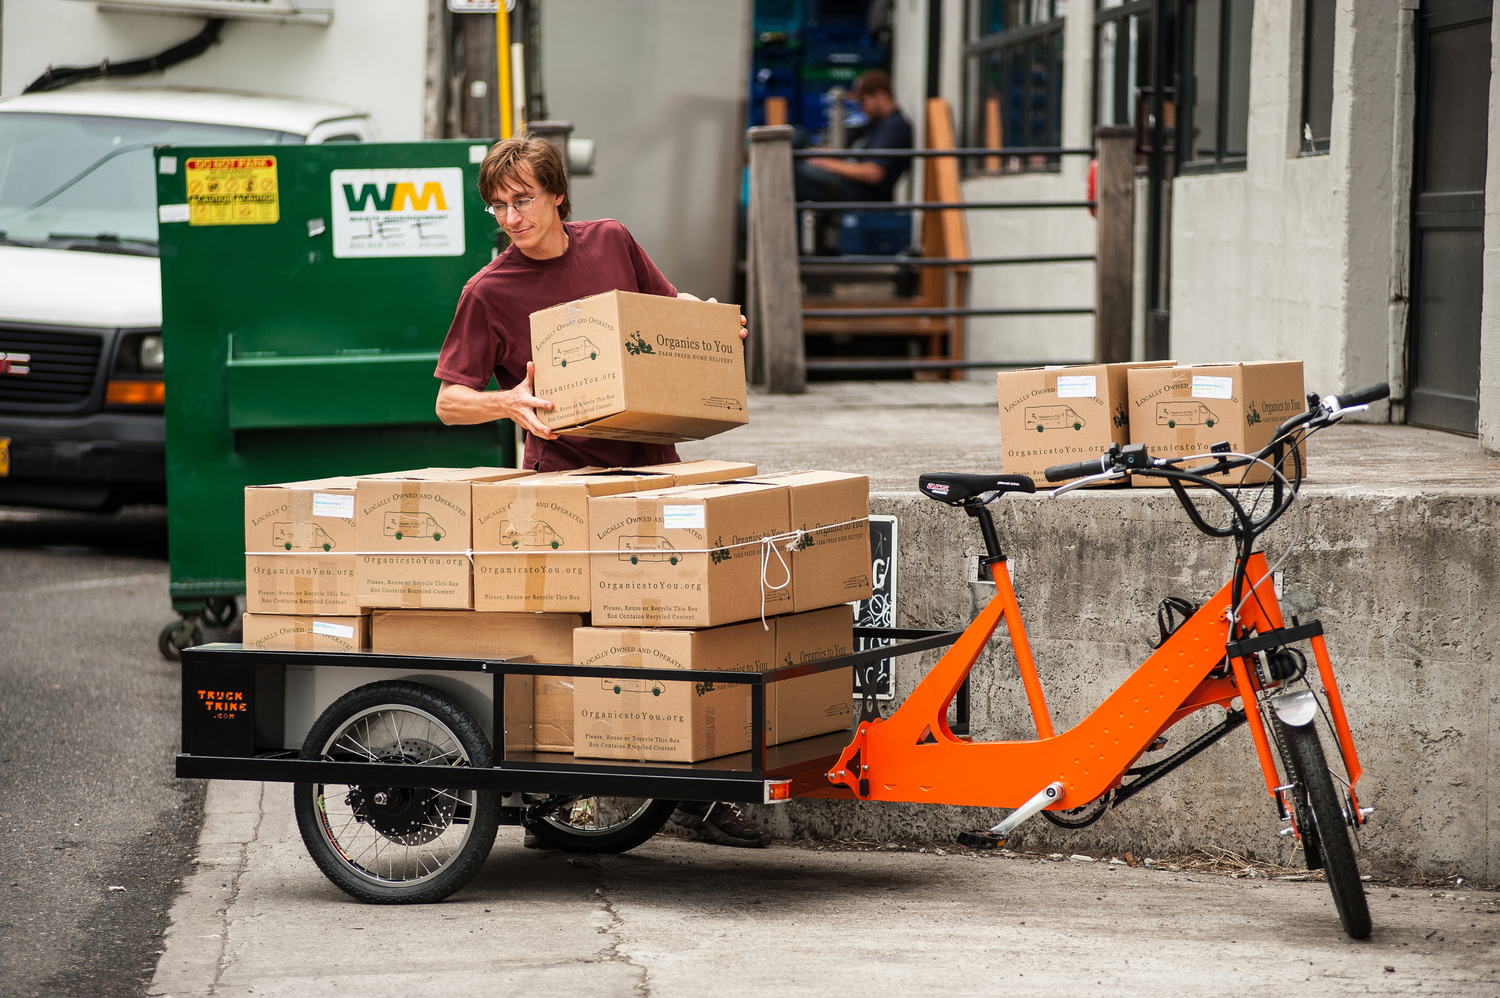 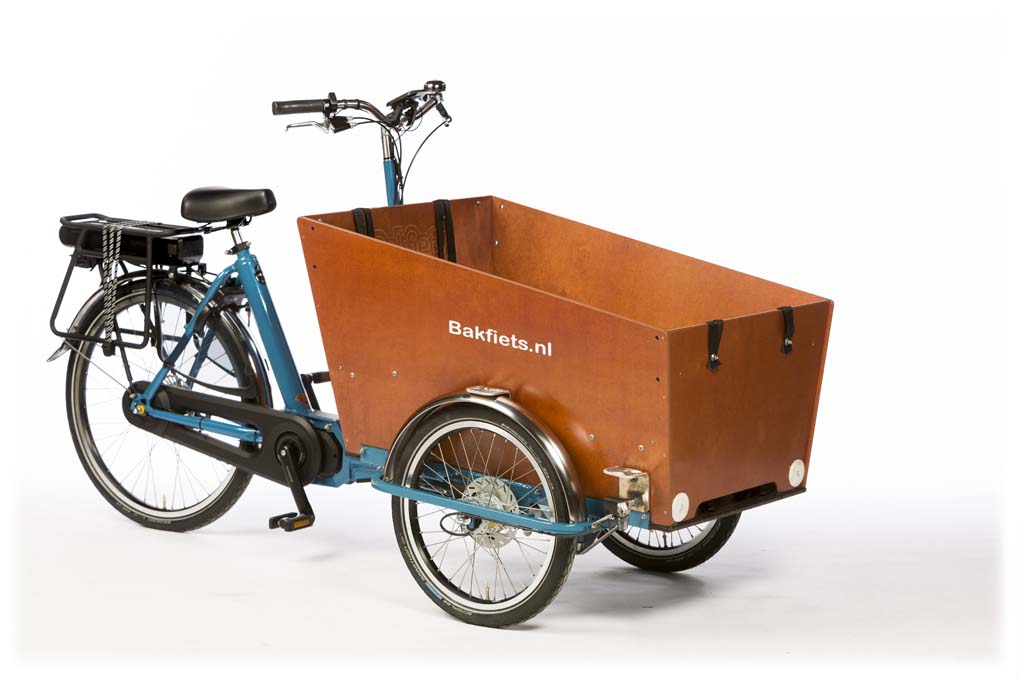  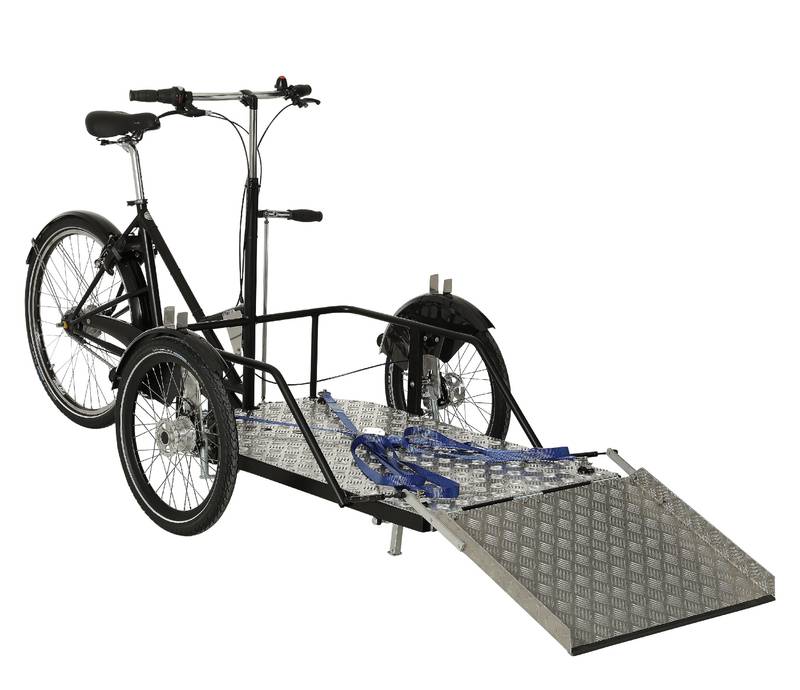  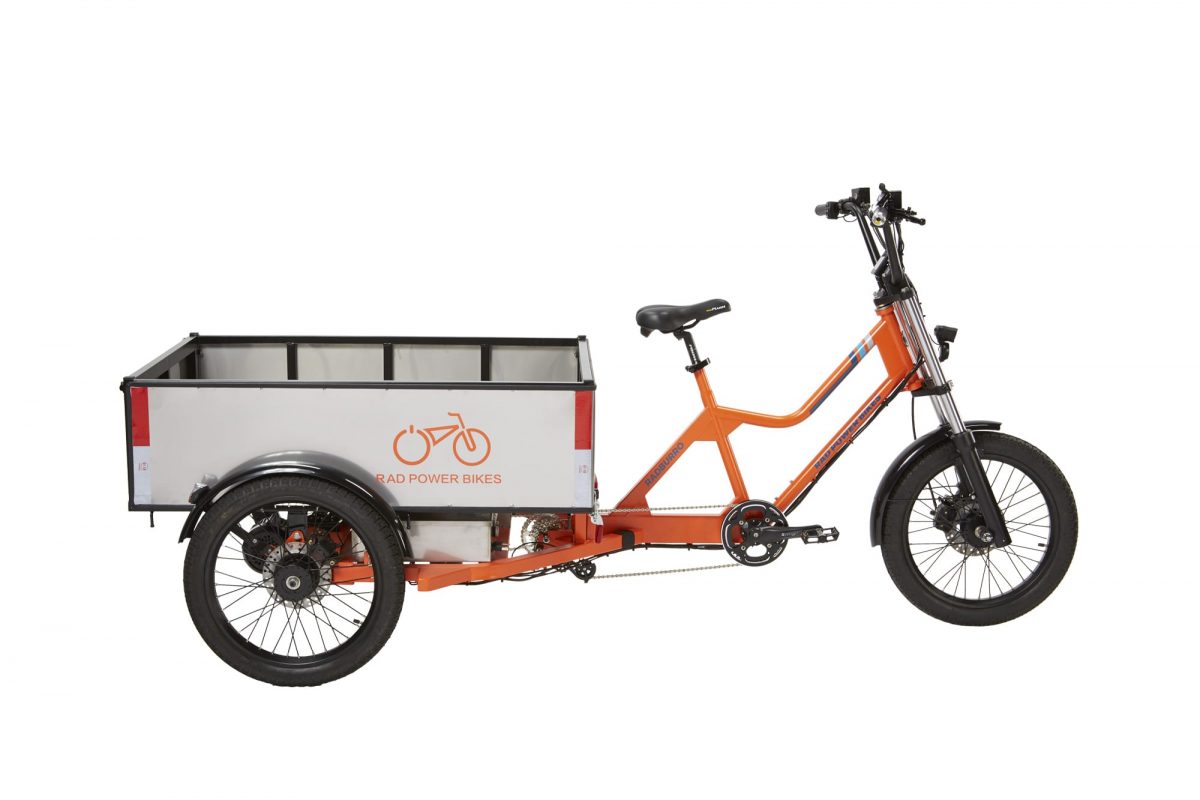 |
| cargo vans |    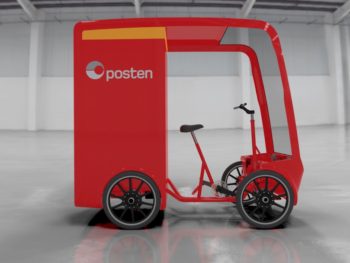  |
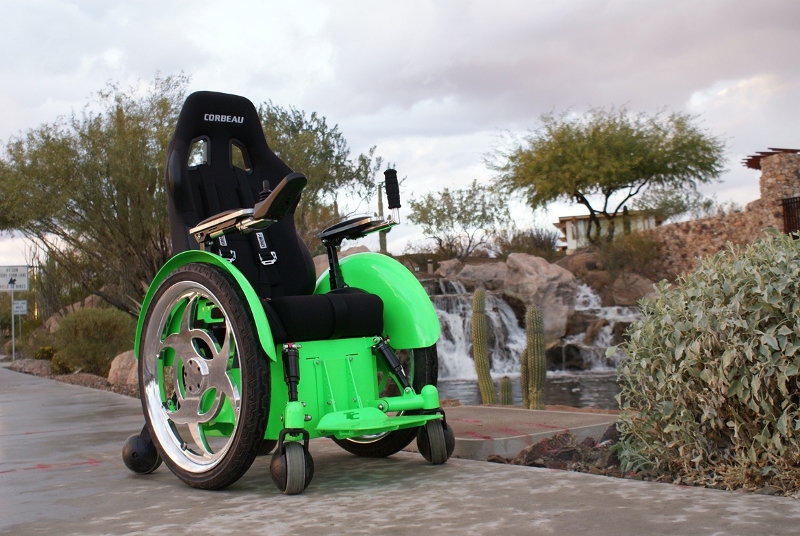
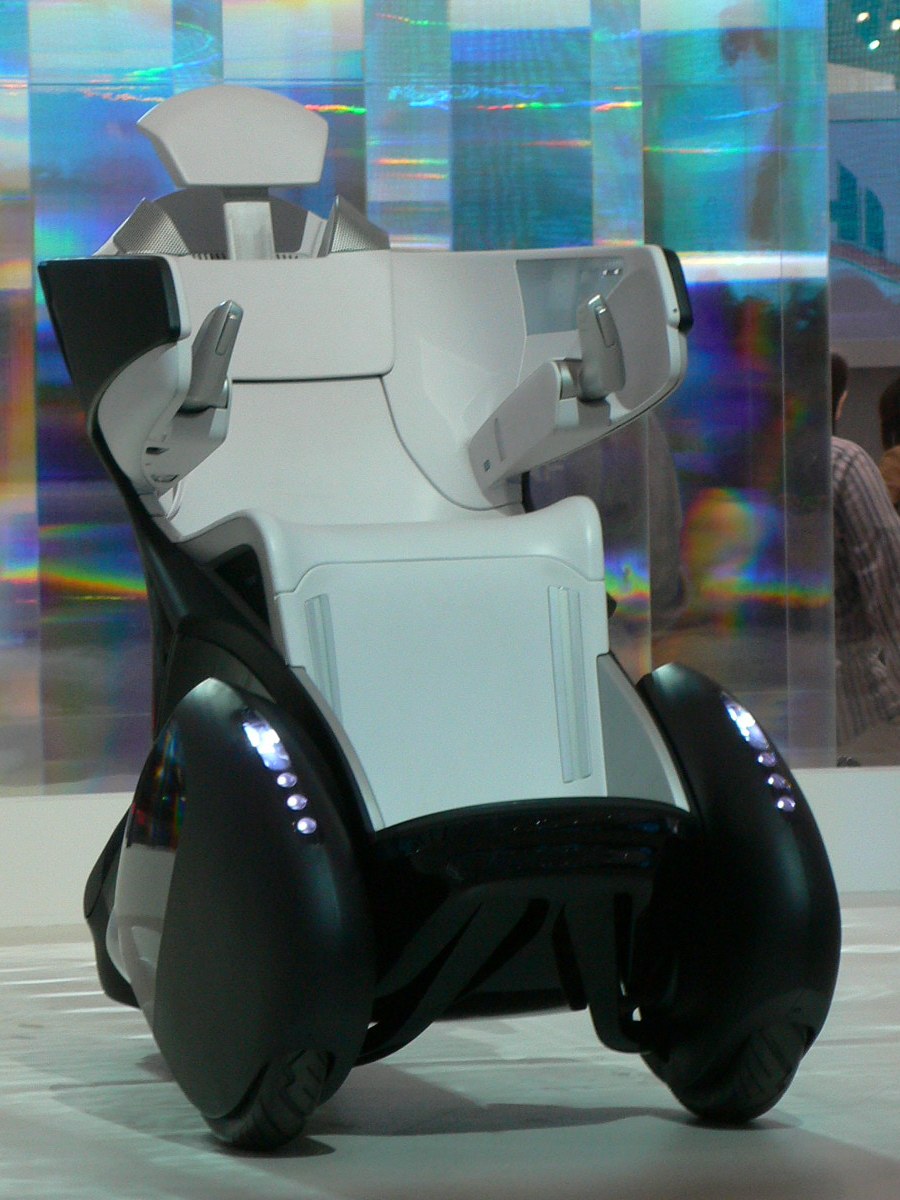
| motor-chairs & wheelchairs |
   |
| hoverboards segways ninebots electric skateboards etc. |
  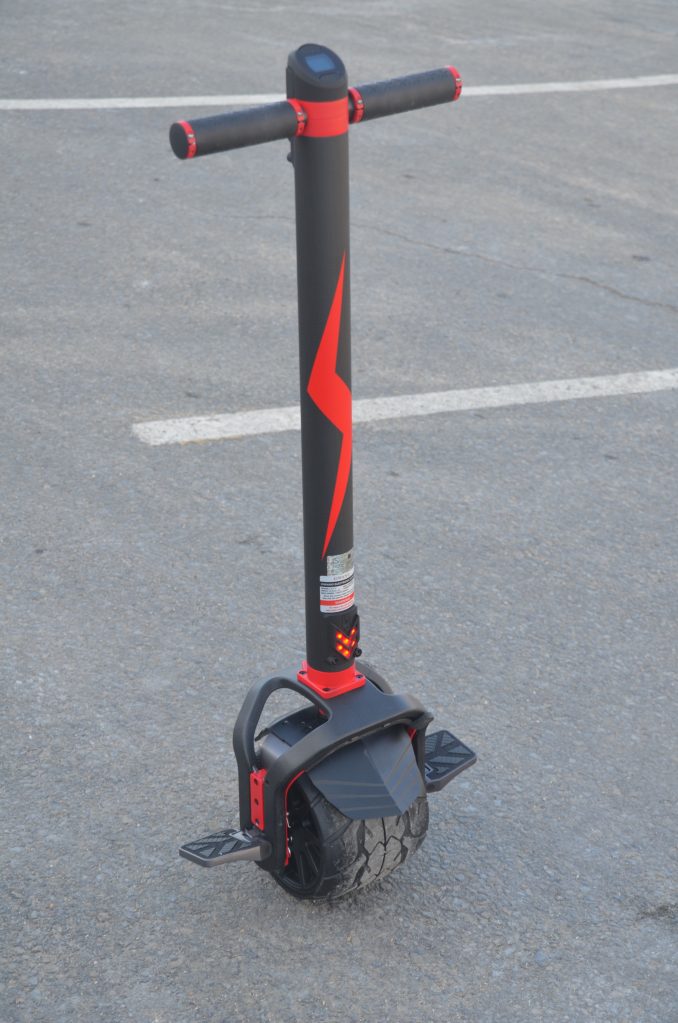 |
| delivery robots |     |
No technology holds as much promise as the humble bicycle—especially when we include its newfangled, electrified cousins—to solve the geometry problem that is getting people short distances around a big city… We don’t need no flying cars. Just give us a place to ride, and watch e-bikes eat everything. 5
Freight
The Impossible City design strives for good urban mobility not just for people, but also for freight shipments and package delivery.
The design constraints for cargo mobility have a lot in common with the design constraints for human mobility, and there’s considerable overlap in terms of what good solutions look like. In the Impossible City design, most packages and cargo would travel on the same elevated bikeway streets that commuters use.
On the bikeway streets, almost all cargo and packages would be carried in narrow, bike-sized vehicles. Cargo vehicles would include human-powered cargo trikes, electric-assist trikes, and fully electric cargo vans, in both 3-wheel and 4-wheel flavors. Self-driving delivery robots could also work well, once that technology becomes reliable and cost-effective.
Cargo trikes and cargo vans are fine for small package delivery, and for tasks involving lots of small items, such as keeping grocery stores and retail stores stocked. Even items as large as sofas and refrigerators are appropriate for small cargo vans.
For larger items, the city needs other alternatives. The Impossible streets are intentionally designed to be large enough to accommodate objects such as standard 40-foot intermodal shipping containers, or the modular mast segments of a conventional construction site tower crane (see video). These wide loads would be the exception, not the rule, because they would take up two or three side-by-side lanes of the bikeway streets, which would inconvenience ordinary commuter traffic. If necessary, the bikeways are also large enough for conventional buses, panel vans, and box trucks.
| shipping container |  (Copyright KMJ, licensed under the CC BY-SA 3.0 license and GNU Free Documentation License.) |
Some oversize items, such as heavy industrial equipment, may be too large to put in shipping containers or box trucks. These items can be transported on ground surface right-of-ways, rather than on the elevated bikeways. The Impossible City design has fewer ground surface right-of-ways, at a wider spacing, and even the ground surface right-of-ways will have a 16’ vertical clearance, identical to the U.S. Interstate Highway standard 16’ clearance.
Emergency vehicles
The Impossible streets are intentionally designed to be large enough to accommodate ordinary fire engines, ambulances, and other emergency vehicles. The city boulevards are painted with lane markings for narrow 6-foot lanes for bike-sized vehicles, but the boulevards themselves are always 4 lanes wide, plus shoulders. The bikeways have an unobstructed width of about 30 feet, and unobstructed height clearance of 14 feet. The entrance and exit ramps are single-lane, but have intentionally been designed to be wide enough for standard emergency vehicles.
Although traditional fire engines can use the boulevards, they may not be necessary. It may be possible for the city to have a larger number of smaller fire-fighting vehicles for different sorts of cargo:
- tender vehicles for hauling water
- pump engines for pumping from sources like canals
- rescue vehicles for hauling floodlights, hydraulic rescue tools, etc.
- hazardous materials vehicles with hazmat suits, etc.
Ideally the Impossible City buildings would all be built with standpipes and fire sprinkler systems, so pump engines and tender vehicles may be less important in an impossible city, allowing the city to instead have more ambulances, hazmat vehicles and rescue vehicles.
A variety of small vehicles can be used for different types of emergency response. These types of vehicles are uncommon here in the United States, but are not a new invention, and are in use elsewhere in the world in places with narrow streets. Examples include:
- motorcycle ambulances(link)
- nontransporting emergency medical service vehicles(link)
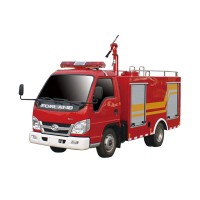
- compact firetrucks, like these:
Chapter 2 — Mobility for prosperity, not for faster commutes
The impossible streets & intersections are designed to yield faster travel times and higher throughput, compared to conventional streets in cities like San Francisco or New York.
Beyond a faster commute
You might think that faster travel times would lead to faster commute times, but, surprisingly, that’s usually not the case. Instead, when faster travel is possible, most people choose to use it to travel further per day, instead of using it to travel for less time per day. (See Rules of thumb: Marchetti.)
In practice, the result of faster travel times is not shorter commute times for everyone, but is instead an increase in daily kinematic range for everyone.
Kinematic range
- Kinematic range is a measure of urban mobility. It’s the number of destinations you can get to in 30 minutes or less (or some other set amount of time).
- Different cities have different kinematic ranges
- In Haxby, Montana, there’s not any traffic congestion, but there also aren’t many places to go. With a car, in 30 minutes you can probably reach a total of about a half dozen homes, with perhaps 10,000 square feet of floorspace.
- In San Francisco, there are lots of places to go, but there’s a lot of congestion. In 30 minutes you can reach hundreds of thousands of homes, offices, and stores, with perhaps 500,000,000 square feet of floorspace. San Francisco has a kinematic range that’s about 50 thousand times larger than Haxby, Montana.
Why does kinematic range matter?
Good mobility is more important than it sounds. It’s not just about making rush-hour traffic a little less tiresome. Beyond just convenience, better mobility and kinematic range bring serious changes to the entire metabolism of a city, and to the amount of opportunity and prosperity available to people.
For people, having more destinations within reach means:
- more job offers that are close enough to commute to — people are statistically more likely to work if they live closer to jobs, and they also have faster job searches and shorter stretches of joblessness6
- more friends & family who are actually close enough to drop by
- more schools to choose from, and more special classes
- more doctors to choose from, and a wider variety of specialists available
- a wider variety of churches and religious communities
- a wider variety of events, meetups, and clubs, and more people who share your interests
- a wider variety of long tail destinations
For shops, employers, and industry, more kinematic range means:
- more job candidates to choose from
- more vendors and parts suppliers to choose from
- more contractors in different specialized fields
- more “industrial agglomeration“, which leads to “agglomeration economies“ (somewhat similar to the separate idea of “economies of scale”)
For 911 calls & first responders, more kinematic range means:
- faster response times and better incident outcomes
Kinematic windfall
Around the world, larger cities, with their larger kinematic ranges, tend to have higher wages than smaller cities.
As city size increases, when the number of people (and destinations) in the city grows by 100% (meaning a doubling in size), then the economy of the city tends to grow by about 115% (meaning it more than doubles in size), so that there is effectively a 15% “bonus” in per capita economic output for everyone in the city.7
This superlinear growth seems to apply to the whole physical and social metabolism of the city, rather than just the economic aspects of the city. The windfall shows up in statistics about:
- wages
- wealth
- patents
- AIDS cases
- crime
- restaurants
- diversity of business services available (meaning, how long the “long tail” of the city is)
“The study finds that when inventors move from a smaller to a large cluster, they experience increases in both the number of patents they generate and the impact of those patents, based on their subsequent citations. For example, a computer scientist who moves from the median cluster to a cluster at the 75th percentile in size would experience a 12 percent increase in productivity, while an inventor in biology and chemistry doing the same would see an 8.4 percent productivity gain. Overall, just a 10 percent increase in the size of a cluster leads to a 0.66 percent increase in the number of patents produced by a top inventor each year.”8
Density & kinematic range
In low-density cities, there are fewer destinations within a given distance, so you have to travel farther to have the same kinematic range as you would in a high-density city. In theory, the low-density city could be less congested, so traffic might flow more smoothly, allowing faster speeds and longer distances in a given amount of time. In some cases it does work out that way, but there’s a lot of variation, and low-density cities may or may not have good kinematic ranges.
Low density cities are susceptible to unfortunate feedback loops. Lower density means more suburban sprawl and longer travel distances, which means more total miles of car trips per day, which means that as the city density decreases, the total number of miles of road (and square footage of road) actually increases. If destinations are no longer close enough to have shared parking, then each destination needs it own parking lot, which takes up more space, which in turn leads to more pressure for even lower density further from the city center, which in turn creates more circulation overhead, more miles of road, and so on.
Cities with high population density may or may not have better kinematic range than cities with lower population densities. If you’re in a city with a high population, that means there are lots of people within a short distance of you, and lots of destinations within a short distance. But kinematic range is about time, not distance. Some very dense cities suffer from serious congestion, resulting in poor kinematic ranges.
The kinematics of existing cities
Larger cities have more total destinations than smaller cities, but some destinations may be too far away for some people to get too. Denser cities have more destinations that are within a shorter distance, but in a congested city, even nearby destinations may take a long time to get to. In practice, different cities have very different kinematics.
Singapore and Dallas-Fort Worth have very different transportation networks, with very different kinematic ranges.
| Singapore | Dallas-Fort Worth | |
|---|---|---|
| population | roughly 6 million | roughly 6 million |
| density | 20,000 per square mile |
600 per square mile |
| main mode of transportation |
mostly public transit | mostly cars |
| time it takes for two people on opposite ends to meet in the middle9 | 60 minutes | 30 minutes |
| estimated 30-minute kinematic range | 25% of all city destinations |
75% of all city destinations |
Improving existing cities
Existing cities, all over the world, have serious traffic congestion problems10,11, despite spending billions on transit projects and on widening roads, in efforts to incrementally improve mobility and kinematic range. As cities grow and economies grow, the congestion problems just get worse.
Cities can improve kinematic range by moving more people or moving people faster
- public transit projects
- the 2nd Avenue Subway project in New York
- the Transbay Transit Center in San Francisco
- more highways, or more lanes
- the Big Dig in Boston
- more throughput per lane
- the HOV carpool lanes in Los Angeles
- the congestion pricing in London
Cities can also improve kinematic range by becoming denser, so that more people and more destinations are nearby
- transit-oriented development
- dense urban cores
- infill development
- multi-use zoning
Someday, in the future, cities might also be able to improve kinematic range by using newly invented transit options
- hyperloop transit tubes
- Boring company tunnels
- flying cars
Co-location is not the answer
“Co-location” is one tempting approach for trying to improve urban traffic congestion problems. Co-location is the idea arranging places in the city so that people are naturally close to where they want to be, to make it so that they don’t have to go as far to get to the places they want to go.
A real-world example of co-location would be a university or boarding school, where dorms, classrooms, cafeterias, and health-care services have all been placed on a single campus, so that students can do most of the things they need to do without ever needing to leave campus.
In a city with mixed-use zoning, new developments could include a mix of housing, retail, offices, and light industrial space. People, could, in theory, live right next to where they work.
This idea comes up surprisingly often in essays about new urbanism. Unfortuntely, co-location isn’t actually practical in big cities. It would be practical, if each person only wanted to be connected to one “thing”. If all you want is to be at university, then living at the university is practical. Or, if all you want to do in life is go to your job, then living near your office is practical. But in reality, most people are a lot more multi-faceted: they don’t just have a job, they also have outside interests like book clubs & sports teams, and they have people in their life that they want to live with or see often, including parents, children, spouses, partners & friends. Most of these people are connected to other places: their own offices, schools, churches, etc. And each of these people has their own set of connected people, branching into a giant social network. Without severing these connections, there is no practical way to “sort” all the people into geographic regions, so that each person is always living near the places they want to get to.
Co-location in not the answer. Co-location is no substitute for mobility.
Transit vs. cars
Here in the United States, in discussions about urban planning and transportation, many people fall into one of two opposing camps:
- pro-transit people, who want to see
- fewer cars on the road
- less space set aside for parking
- more bike lanes and bus lanes
- more funding for some combination of subways, light rail, buses, bus rapid transit, and other public transit
- pro-status-quo “car” people, who
- do not want to lose automobile lanes in return for bike lanes and bus lanes
- do now want to pay the huge costs of creating and operating public transit systems
- do not want to take slow, inconvenient, public transit options when they could just drive
In addition to the pro-transit camp and the pro-status-quo camp, there’s also a third camp: people who are optimistic about new technologies for automated, on-demand transportation, like self-driving cars and delivery drones.
Proponents of shared, self-driving cars point to advantages like the greatly reduced need for parking compared to conventional cars, yet the convenience of direct door-to-door routes.
Opponents of self-driving cars point to inherently low throughput-per-lane numbers for cars vs. buses and trains, and the real-world congestion problems that we’re already seeing from on-demand car-share services like Lyft and Uber.
The “Impossible City” design proposal
Given what we know about the cost and throughput of cars, buses, and rail, and given what we know about the emerging new alternatives, what’s the best we could possibly do?
If we could plan a whole urban transportation network from scratch, what’s the optimal mix of different transit modes? Which options are the most affordable, and which ones maximize personal mobility, speedy deliveries, and kinematic range?
What follows is a design proposal for what I believe is a simple, cheap, reliable, low-risk city transportation network that has high throughput, good transit speed, nearly door-to-door convenience, and takes up less space than roads, leaving more land area for parks and buildings.
The Impossible City is just one simple design for a more kinematic city and its transportation network. I’m not suggesting that this is the best design; rather, I’m putting it out as a straw-man proposal, in hopes that it might be a step in the right direction, and that it might spark conversation that leads to better ideas.
The Impossible design calls for:
- bikes & bike-sized vehicles only, instead of cars, trucks, buses, or trains
- electric vehicles only, instead of gas engines
- grade-separated intersections only, instead of traffic lights, stop signs, or roundabouts
- sheltered roads, sheltered from wind and rain
- underground wiring, instead of telephone poles and overhead power lines
What would it look like?
A grid
- The Impossible design has a grid of city blocks, similar to places like Manhattan New York. That’s in contrast to older cities like Rome and Paris, which have more intricate street layouts, and in contrast to many 20th century suburban developments or new cities like Dubai, which often have more circular or curvy streets, or layouts that are intentionally asymmetrical, with cul-de-sacs and loops.
A big grid
- Instead of the rectangular blocks that Manhattan has, the Impossible design has square blocks. Big blocks: more like big Salt Lake City blocks than little Portland, Oregon blocks.
With normal buildings
- The buildings in each city block would just be normal buildings. They could be mid-rise or high-rise, in any sort of architectural style.
But with sheltered streets
- The “streets” would look very different from normal city streets:
- They would not be outdoors, but would instead be long breeze-way corridors inside a four-story building.
- They would not be at ground level, but instead would be up on the second or third floor.
- They would not have intersections, but instead would be “grade-separated”, so that the east-west streets pass above the north-south streets.
Why is this a better design?
The Impossible design is built entirely around bicycles, bike-sized electric vehicles, and sheltered streets with no intersections. At first blush, it’s hard to imagine that this is a practical design. It doesn’t seem like an entire city could have no buses, trains, or cars, and still manage to move millions of people a day with reduced travel times and increased travel ranges.
It seems impossible, because cars seem like fast, long-range vehicles, and buses and trains seem like high-capacity transit.
Cars truly are fast when they’re on highways, but in cities cars are hugely inefficient and ineffective, requiring huge amounts of lane space per car, and traveling with high burst speeds but poor average speeds.
Buses and trains truly are high-capacity and high-throughput when everyone on them is going from point A to point B. If you have a group of 50 people who are all gathered together (e.g., at a hotel) and who all need to go to the exact same place (e.g., an office or work site) at the same time, then a bus is a wonderfully efficient and effective choice. But in a city, if people are starting from a variety of different places (different apartment buildings on different blocks), and going to a variety of different places (schools, stores, offices), then buses turn out to have quite poor average throughput.
Chapter 3 — Bonus features beyond mobility
If you’re building from scratch, then with a few good design choices it’s possible to build an urban layout that works far better than traditional cities do. New designs can maximize:
(A) Affordability
(B) Blank (this space intentionally left blank)
(C) Conviviality & convenience
(D) Durability, reliability & resilience
(F) Freedom, independence & agency
(H) Health & safety
Affordability
There’s no point in designing a new urban development that is too expensive to build, and no point in building a new urban development that is too expensive for people to afford to move to.
- Affordable to build
- The Impossible street design uses conventional construction techniques and avoids the most expensive transportation options:
- no buses (at $500,000 each, or $8,000+ per passenger seat)
- no subway cars (at $10,000+ per passenger seat)
- no subway tunnels (at $100,000,000+ per mile)
- no automobiles (at $20,000+ each)
- no multi-story parking garage structures (at $20,000 per parking space)12
- no sprawling suburban road network
- The design lends itself to mid-rise density neighborhoods. Mid-rise housing, for example in buildings with “4-over-1” podium construction, is less expensive to build than skyscrapers, and less expensive than even ten-story buildings with concrete service cores. Mid-rise construction also has lower initial embodied energy per square foot, and lower ongoing operating costs. Mid-rise housing is also less expensive than detached single family housing. 13,14
- The Impossible street design also offers an optional extra feature that could replace ordinary sidewalks with inclined ramps, which would offer additional cost savings by conserving usable floorspace square-footage (vs. circulation overhead) while entirely obviating the need for elevators, escalators, and stairs.
- For new developments built on greenfield sites, land should cost less than what it would cost in an established city. For new developments that are large, the development may gain economies of scale in land acquisition, regulatory approval for planning and permitting, financing, and construction costs & timelines.
- The Impossible street design uses conventional construction techniques and avoids the most expensive transportation options:
- Affordable to operate
- The Impossible street design avoids all the costs of running public transit systems (bus driver salaries, rail car maintenance, etc.) and avoids the costs of private car ownership (insurance, car payments, fuel, new tires, etc.).
- Affordable to live in
- Ideally, the lower costs to build and operate the city will mean that it is more affordable to live in.
- With lower government transportation subsidies, there is an opportunity to have lower taxes & lower vehicle registration fees.
- With lower housing construction costs, new housing doesn’t need to be as expensive.
- With a higher-capacity transporation system in place, the Impossible design can support more units of housing before congestion sets in, creating the opportunity for denser zoning and land use plans, more housing construction, and less of the exclusionary zoning supply-side shortages that lead to high housing costs in places like the San Francisco Bay Area.
- With more units of housing within kinematic range of any given workplace, renters have more choices, landlords face more market competition, and there should be more market efficiency, without artificially inflated prices. Hopefully this will result in market-rate housing that is naturally affordable, without the government having to impose rent control or subsidize affordable housing. Hopefully this might lead to less homelessness, which in turn could lead to lower government spending.
- Ideally, the lower costs to build and operate the city will mean that it is more affordable to live in.
Conviviality & convenience
Significantly increased mobility & kinematic range means that it’s easier to go see people and easier to get to more places. A more mobile city is a city with more social opportunities and social prosperity.
- Convivial
- easy to go see your friends & family
- easy to do an errand for your mom
- easy to go to weird new clubs and meetup groups to see who’s there
- easy for kids to go to parks & playgrounds on their own, without needing a ride
- Convenient — easy access to:
- school & work
- groceries & restaurants
- gyms & laundromats
- dentists & doctors
- libraries & museums
- long tail destinations — including That One Unusual Thing that most people wouldn’t care about, but that you really want to go to:
- a monthly Renaissance Faire meetup
- a weekly Burning Man art car workshop
- a maker space with an Atomic Force Microscope
- etc.
Durability, reliability & resilience
By striving for simplicity, these new designs avoid using lots of “fragile” technologies, like elevators and traffic lights.
- Durable & reliable
- The Impossible design is a more reliable design, because it has fewer parts that can break, and fewer parts that need power sources. It has a transportation system that can be run by human power alone, if necessary. That’s one of the advantages of getting rid of all the traffic lights, buses, subway cars, automobiles, taxis, elevators, escalators, delivery drones, etc.
“Even when a [New York City subway] station has an elevator, workers have struggled to keep them working properly. Only about 94 percent of elevators were available in August, according to the transit agency. The rate is worse for escalators – 87 percent were working.” 15
- Resilient
- The new design is intended to be much more resilient after a natural disaster like an earthquake, hurricane, or flood. It should be possible to evacuate a building quickly in an emergency, even when the power is out. It should be possible to evacuate a city quickly without running into problems with downed power lines and traffic lights that have gone dark.
Economic prosperity
A city should provide for a good life for the people who live in it and work in it. As described in chapter 2, the Impossible design strives to maximize mobility and kinematic range, with the goal of harvesting a superlinear windfall in wages, wealth, patents, land value, etc. The design is intended to create cities that thrive economically compared to similarly-sized typical cities, with more prosperity, and greener prosperity.
- Prosperous
- When I say “prosperous”, I don’t mean Wall Street bankers with vacation homes in the Hamptons. I mean prosperity in the sense of kids who get to go to good schools, teachers who have the books they need, parks with playgrounds and basketball courts, libraries with books & wifi, parents with jobs and health insurance, and jobs with safety standards and protective equipment. These are things that are common in places like rich European countries, and that can become more and more common everywhere in the world.
- Green growth
- Global poverty is a serious problem, and economic growth is a force for good, so long as the economic growth is “green growth” and so long as GDP growth goes up while carbon footprint goes down, habitat restoration use goes up, and Gini coefficients go down.
Prud’homme and Lee’s paper, titled “Size, Sprawl, Speed and the Efficiency of Cities,” shows that productivity per worker is closely correlated to the average number of jobs per worker that are reachable in less than 60 minutes. In Korean cities, a 10 percent increase in the number of jobs accessible per worker corresponds to a 2.4 percent increase in workers’ productivity.16
People who live closer to jobs are more likely to work. They also face shorter job searches and spells of joblessness. Proximity to employment proves particularly important to certain kinds of workers and residents. For instance, the duration of joblessness among black, female, and older workers tends to be more sensitive to job accessibility than it is for other kinds of workers. For poor residents, living closer to jobs increases the likelihood of working and leaving welfare. Proximity matters for lower-income, lower-skill workers in particular because they tend to be more constrained by the cost of housing and commuting. They are more likely to face spatial barriers to employment, thus their job search areas tend to be smaller and commute distances shorter. In contrast, higher-income, higher-skill workers, who can afford to commute by car and exercise more choice in where they work and live, have more prospects than just the jobs near their neighborhoods and commute longer distances on average.6
Freedom, independence & agency
A city design should not inadvertently restrict people’s freedoms, limit people’s independence, or obstruct fair access. The Impossible design offers more:
- Freedom, independence & agency
-
freedom of movement for everyone in the community
-
freedom to travel without being asked for a license & registration
- more kid-friendly streets
- kids can visit friends or meet up to play at the park without being dependent on a parent for a ride
- kids can walk to school without learning how get across dangerous intersections
- kids can run errands around town for their folks
- more elder-friendly streets
- older people can get out of the house and run errands independently, without needing services like Lyft, Uber, or Meals on Wheels
- more disability-friendly space
- safer streets for people with limited vision or limited hearing
- better accessibility for people in wheelchairs
-
- Fairness
- Accessibility
- stroller-friendly buildings and stroller-friendly transportation
- wheelchair accessible routes to every part of every building
- predictable navigation for people with limited vision
-
frequent pathside seating for elderly people
In 1896, Susan B. Anthony said bicycling was doing “more to emancipate women than anything else in the world.” 20
“Nearly half of American kids walked or biked to school in 1950; today that figure is 13 percent.” 21
Green sustainability
Compared to a conventional city, the Impossible design should provide:
- Lower carbon footprint per capita
- lower-energy commutes in smaller, more efficient vehicles
- more efficient heating and cooling of buildings
- More trees
- more trees nearby at any one time, and more trees encountered per day
- Better air quality
- no diesel engines, no gas engines, less motor oil, less tire wear
- more parks and trees
- Less noise
- no cars and no car noise, means, in practice, less overall noise, even with much higher urban densities 22
Health & safety
An Impossible City should be safer and more fun to live in.
- Healthier
- more opportunity to exercise while commuting
- better air quality & less noise
- less stressful, with less traffic congestion and more parks & trees 23
- Safer
- no traffic accident deaths
- faster 911 response time
-
freedom from harassment on buses & subways
“Over 1.35 million [traffic] deaths and up to 50 million injuries occur every year, with 90% of these fatalities occurring in low- and middle-income countries” 24
Below 18 mph “pedestrians are more likely to survive being hit by a car than die, while at higher speeds the reverse is true” 25
“Small changes in speed have big impacts on fatality rates: a person is 70 percent more likely to be killed by a car moving at 30 mph versus 25 mph.” 26
“Improvements in response time and medicine are responsible for about one-third of the reduction in fatality rates from crashes in the UK.”25
How would it compare?
| Proposed Impossible City | San Francisco | New York | |
|---|---|---|---|
| Trips annual, per million people |
1.2 billion | 1.2 billion27 | |
| Commute time minutes per day (average per commuter) |
60 minutes | 60 minutes | 76 minutes |
| Traffic fatalities annual, per million people |
1 | 30 | 23 |
| CO2 footprint for transportation annual per capita |
1 kg | 2,000 kg | 1,000 kg |
| Commute kinematic range square feet |
5 billion | 1.25 billion | |
| Kinematic windfall wages, GDP, patents per capita, etc. |
1.3x | 1x | |
| Proximity to friends number of neighbors within 15 minutes |
2 million (without car) |
1 million (requires car) |
|
| Proximity to places number of places within 15 minutes library, coffee shop, playground, groceries |
2x (without car) |
1x (requires car) |
|
| Proximity to trees number of trees within 15 minutes |
> 125,000 trees | > 125,000 trees | |
| Cars per million people |
100 | 450,000 | 220,000 |
| Trucks per million people |
100 | 60,000 | |
| Buses, etc. buses, streetcars, light rail vehicles, etc. per million people |
1 | 1,380 | |
| Cost to city to subsidize public transit annual dollars per capita |
$0 | $720 | |
| Cost of public transit paid by riders annual dollars per capita |
$0 | $360 | |
| Cost of car ownership gas, insurance, repairs, payments, etc. annual dollars per capita |
$0 | $4,000 | $2,000 |
| Cost of bike ownership bicycles, mopeds, scooters, segways, trikes, etc. annual dollars per capita |
$1,000 | $100 | |
| Exercise while commuting minutes per day (average per commuter) |
15 minutes (if 3 of 4 bikes are e-bikes) |
5 minutes | |
| Air quality | really good | good | |
| Noise levels | slightly lower than San Francisco22 |
slightly more than proposed city |
|
| ADA accessibility percent of total city floor space |
90% | ? | |
| Free-range kids | yes | no | |
| Power-outage impact on transit times |
no bikeway lights (just daylight/moonlight) |
no BART no traffic lights |
|
| Daylighting Spatial Daylight Autonomy (sDA) percent Annual Sun Exposure (ASE) percent (also several others) |
|||
| Home sizes square feet per person, average |
275 | 275 | |
| Office space square feet per person, average |
260 | 260 | |
| 911 response time minutes, average |
4 minutes | 5.75 minutes |
Chapter 4 — Why this matters now
Figuring out how to design better cities is especially important right now, at this moment in history, for a few reasons.
- The urban population boom
- Urban population is about to increase by 60%, with 2.5 billion more people incoming by 2050.
- The urban construction boom
- There is projected to be a doubling of total built space by 2050.
- The rise of “megacity” urban agglomerations
- By 2050, we will have 175 cities with populations between 4 million and 40 million.
- The onset of kinematic lag
- Large cities are increasingly suffering from congestion and kinematic lag.
- The mounting lost opportunities
- Kinematic lag is already a problem that artificially depresses global GDP by trillions of dollars per year, slowing the rise out of poverty of billions of people.
- The rising current opportunities
- If we could get better at city design now, then in the next few decades we could prevent additional losses from kinematic lag on the order of $5 trillion dollars per year, as well as seeing a windfall of $15 trillion in residential real estate value. Unfortunately, in practice, that will be impossible.
There’s no way to cheaply or practically re-build existing cities, or move people en masse from existing cities to new cities, but, when new cities, new suburbs, and new satellite developments are being planned and built from scratch, it would be slightly crazy to fail to try designing them as “kinematic cities”. Building from scratch has its own challenges, and is also crazy expensive, but it does have the advantage that it can be done much more quickly.
The Impossible design does not depend on a particular climate, or on particular building materials. It’s an anywhere-in-the world city, not just a European city, an African city, or an Arctic city. It could be built on the outskirts of an existing city, or it could be built in a brand new “greenfield” site.
“If you build a new city you don’t have to relocate or work around existing roads or rivers or factories or houses. You also don’t have to work around existing political processes, community groups, civic organizations … or even existing regulations and rules.”28 — John Macomber, senior lecturer, Harvard Business School.
Urban population boom
In the next 30 years, by 2050, urban population is expected to grow by 60%, with another 2.5 billion more people living in cities.28
| Year | Urban portion of world |
Total urban population29 |
|---|---|---|
| 1950 | 0.75 billion | |
| 2018 | 55% | 4.2 billion |
| 2050 | 68% | 6.7 billion |
Perhaps existing cities will absorb nearly all of the 2.5 billion additional people who will live in cities by 2050, but in doing so some of their suburbs will essentially develop into big satellite cities of their own right. The Impossible City ideas are relevant for how new developments in those satellite cities are designed. If 4% of those 2.5 billion additional people did move to entirely new urban developments, that would be 100 million people in new urban developments.
Urban construction boom
Existing cities are too few and too small, by a factor of two, for everyone who will live in them by 2050. To handle the influx, cities will build another 2.5 trillion square feet of new buildings. These numbers can be hard to believe at first. For different projects by different authors, see the notes about urban growth below.
This wave of construction is going to happen no matter what, whether we prepare for it or not. People will build housing for themselves, even if they can’t do it legally, in slums and informal settlements like those in Kibera, Dharavi, Neza, and Orangi Town. If we could muster more planning, forethought, and funding, then these new developments could end up with infrastructure like comprehensive sewer systems and high kinematic-range transportation networks.
“If we stick to business as usual most of it is going to be disorderly and less functional than the stuff we already have.”28 — Paul Romer, Nobel prize-winning economist, New York University.
“Megacity” urban agglomerations
Currently, the world has about 33 “megacities”, where a megacity is defined as an urban agglomerations with more than 10 million inhabitants. The world is projected to have 43 megacities by 2030, and about 50 megacities by 2050, with an additional 125 large-but-not-mega cities that land in the range between 4 million and 10 million inhabitants.30
City clusters already exist of course, like the Randstad in the Netherlands, which links Amsterdam, Rotterdam, The Hague, and Utrecht. The urban development around San Francisco Bay could also be considered a city cluster. What is different with the Chinese concept of cluster is their scale. The Randstad connects only 7 million people, while San Francisco Bay (including Silicon Valley) has only 6.2 million people. By contrast, the urban cluster of the Pearl River Delta already had 65 million people in 2010, larger than the entire population of the United Kingdom but concentrated on less than 10,000 square kilometers! The recent urban cluster including Beijing-Tianjin-Hebei links together more than 105 million people.16
Kinematic lag
Kinematic range generally increases as cities get bigger. I believe that increase in kinematic range is what drives the superlinear scaling effect.
As a city grows, at first, kinematic range increases as population increases, perhaps in a roughly linear relationship. Unfortunately, as cities get too big, they start to sprawl and suffer from traffic congestion. Eventually, there’s a kinematic lag, where the kinematic range stops its 1-to-1 tracking of population growth, and begins to lag behind.
This whole Impossible Cities proposal is all about trying to reduce that kinematic lag in larger cities. The proposed Impossible City design is an attempt to keep increasing a city’s kinematic range even as its population grows in the multi-millions.
As the world adds more and more large cities and megacities, kinematic lag becomes a bigger and bigger problem, kinematic range becomes more important, and design ideas like the Impossible City design become more important.
“Contrary to common perception, megacities have not been driving global growth for the past 15 years. In fact, many have not grown faster than their host economies, and we expect this trend to continue. We estimate that today’s 23 megacities will contribute just over 10 percent of global growth to 2025, below their 14 percent share of global GDP today. Instead, we see the 577 fast-growing middleweights … contributing half of global growth to 2025, gaining share from today’s megacities. Worldwide, we will see 13 middleweight cities become megacities by 2025.”31
Lost opportunities
Take the San Francisco Bay Area as an example. The Bay Area is a conurbation that encompasses major cities like San Francisco and San Jose, as well as lots of smaller cities, like Oakland, Berkeley, and Mountain View. The entire population is about 8 million people, depending where you draw the boundaries.
If you estimate floorspace at about 600 square feet per person, that means there’s about 5 billion square feet of floorspace in the Bay Area. Your thirty-minute kinematic range (KR30) would be 5 billion square feet, if you could magically get from any point in the area to any other point in under 30 minutes. But you can’t.
As a rough estimate, let’s say that from any room in any random building in the Bay Area, within 30 minutes you can reach about one quarter of the other buildings in the Bay Area. That means your actual 30-minute range would be about 1.25 billion square feet.
If we could just improve your travel times enough, we could quadruple your KR30 range. If kinematic range is in fact what drives the superlinear scaling effect, then doubling the 30-minute range for the Bay Area would yield a 15% windfall in average hourly wages, patents per capita, GDP, etc. Doubling the 30-minute range gets you a 15% windfall, and quadrupling gets you a 30% windfall (actually more like 32%, because 1.15^2 is 1.3225).
GDP. The San Francisco Bay Area GDP was about $535 billion in 2019.32 A 30% annual increase would be an additional $160 billion annual GDP.
Real estate. The San Francisco Bay Area has about $1.3 trillion of residential real estate. A 30% increase in value would be a $400 billion increase, just for the residential portion of the real estate. Commercial real estate would be roughly another $400 billion. There would also be additional floor space in the roadway buildings, which might amount to another $200 billion, for a total of about $1 trillion of additional real estate value. San Francisco is one of just a few cities in the United States that has a market value higher than the $1 trillion Apple Inc. value.33 But other cities have even higher real estate values. In New York City, the housing alone is worth $1.5 trillion. In the Upper East Side, housing value has reached $100 billion per square mile.34
Hope? I’m not suggesting that anyone could somehow re-build the San Francisco Bay Area to quadruple kinematic range, but I am saying that hypothetically, if the Bay Area had been built kinematically to begin with, then the real estate would be worth $1 trillion more than it is now. In the case of the Bay Area, that’s $1 trillion in real estate value that somehow got left on the table: value that was lost just because of past choices about streets, geometry, and buildings.
Is it conceivable that the Bay Area could be re-engineered to quadruple travel ranges? Yes, but it would require a lot of changes: maybe a hyperloop, or a lot of Boring Company tunnels. It would be expensive, and it would take decades. The Bay Area has already calcified, and for all practical purposes, big changes now are pipe dreams. For context, here are a few examples of the giant cost of modest mobility improvements:
- the 2013 Bay Bridge Eastern Span, from San Francisco to Oakland, took over a decade to build and cost $7 billion
- the 1976 BART system was a comparable amount, if measured in today’s dollars
- the 2006 Big Dig in Boston cost $21 billion
Current opportunities, GNP
As of 2017, the worldwide gross national product (GNP) was about $80 trillion per year. Some of that GNP comes from rural activities, like farming, and other remote activities, like mining and fishing. But the majority of GNP, more than 80%, comes from urban areas, for a total of about $65 trillion per year.31,35
By 2050, global GNP will probably roughly double, to about $160 trillion per year. By 2050, more than $140 trillion of that total is likely come from the urban areas.
Some of those “urban areas” are actually small towns with just a few thousand people, but increasingly, the majority of the urban population will be living in larger and larger cities, and those large cities also generate a disproportionately high amount of the total GNP. By 2050, about 16% of the world’s population, 1.6 billion of the world’s 9.8 billion people, will be living in the world’s 175 largest cities, with 4 million to 40 million people each.30 A conservative estimate suggests those 175 cities will contribute $30 or $40 trillion per year to worldwide GNP.
Because of their size, all of those 175 cities will probably suffer from kinematic lag. If we could intervene, and by 2050 we could somehow double the kinematic range in each of those cities, we could expect to yield a 15% kinematic windfall on the GNP from those cities. A back-of-the-envelope calculation suggests that would be an ongoing windfall of maybe $4 trillion to $6 trillion per year in increased GNP. Other authors give significantly higher values for annual return in increased GDP from urbanization:
In Africa “we should be building 40 million new homes or 160 Atlantas every year. … Africa has 54 countries. Altogether they do not build 1 million homes a year. The gap is the opportunity. 40 million modest homes require an investment of more than $1 trillion every year. The multiplier effects would add $10 trillion to annual GDP. That is 5 times current GDP. Closing Africa’s housing gap can generate 5 times current GDP!” — Paul Musembwa, CEO of Warp Developments
In a paper published in 2015, the economists Chang-Tai Hsieh and Enrico Moretti found that, between 1964 and 2009, the high cost of housing in some US cities relative to wages had lowered aggregate US GDP by 13.5 percent: “Most of the loss was likely caused by increased constraints to housing supply in high productivity cities like New York, San Francisco and San Jose. Lowering regulatory constraints in these cities to the level of the median city would expand their work force and increase U.S. GDP by 9.5%.16
Current opportunities, land value
In the San Francisco Bay Area, the total residential and commercial real estate is worth about $2.6 trillion.
The total value of all real estate, worldwide, was about $280 trillion at the end of 2017. Of that total, most is residential real estate, at $220 trillion, with just $33 trillion of commercial real estate and $27 trillion of agricultural real estate. Worldwide, residential real estate is worth more than all of the equities & debt securities combined. 36
In Manhattan, land value grew at an annual rate of 5.5 percent beyond inflation 1950 to 2015.37 That’s an unusually good return, but in general real estate value has increased at roughly the same pace as GNP. By 2050, total worldwide real estate might be worth about $560 trillion.
By 2050, the world’s 175 largest cities will have residential real estate worth more than $100 trillion. If we could double the kinematic range in those cities, we could expect to yield a 15% kinematic windfall, for maybe a $15 trillion increase in residential real estate value. Unfortunately, trying to double the kinematic range of even a single city is probably impossible.
In a world where another 2.5 billion people will be moving into cities in the next 30 years, we should think twice about how much prosperity we want to leave on the table. Real estate developers who care about the value of their land should care about building kinematically. And it’s not just real estate. It’s also hourly wages, GDP per capita, and patents per capita. Our current cities are sub-optimal to the extent that there are hundred of billions of dollars of lost value per major city. Anyone, or any coalition, who can optimize on that can begin to harvest that windfall. In practice, the windfall would get split up between lots of different parties, with enough incentives to go around.
There would be:
- company founders, with early equity stakes in the companies involved
- inventors, getting royalties on patents for, say, new spatial layouts
- architects getting licensing fees on blueprints & construction specs
- property managers, getting lease and rent income
- previous land-owners, profiting on the sale of land to the new city
- real estate developers, getting property value appreciation
- anchor employers, getting tax incentives & incentive investments
- new employees, getting big relocation bonuses & brand new housing
- early homeowners, getting in the ground floor on property values
- county governments, getting new property tax revenue
- state governments, getting new income tax revenue
- local airports, getting new flights & additional passenger revenue
- etc.
Chapter 5 — Why this is impossible
We know that:
- The world is rapidly building more cities & bigger cities. (See chapter 4)
- For new urban areas, we could design new 21st century transportation networks that would work far better for people than the default 20th century designs. (See chapters 1, 2 & 3)
Unfortunately, actually building cities this way is probably impossible, because of:
- Location problems
- Network effect problems
- Cost problems
- Bootstrapping problems
- Land value capture problems
Location problems
These new urban development designs could be built in a few different types of locations, but they all have problems:
- Infill in existing cities and/or rebuilding portions of cities
- Retrofitting infrastructure in existing cities can be several times more expensive than building new infrastructure in new sites.38
- Land is much more expensive to acquire in existing cities than in remote areas.
- Opportunities for buying large parcels of land are rare.
- There are no easy ways to integrate the new Impossible neighborhood’s transportation network into the existing city’s transportation network(s). (See network effect problems below.)
- Neighbors frequently oppose developments that increase density.
- Zoning restrictions typically restrict changes in land use and density.
- For example, 75% of residential land in Los Angeles is restricted to single-family homes, as is 94% of land in San Jose39
- New suburbs and/or satellite cities around existing cities
- Land anywhere near large cities is expensive
- Large parcels are rare.
- Connections between the new suburb’s Impossible-style transportation network and the city’s existing transportation network(s) will require people to transfer between vehicles mid-trip, and will decrease mobility and kinematic range. (See network effect problems below.)
- Greenfield cities and/or “new city” developments
- Before starting construction, the new city project will need to pre-purchase (or otherwise reserve) all of the adjacent land that the city may someday need to grow into. Starting with anything less than 100 square miles of land may mean the new development is restricted from ever growing to become a “megacity” urban agglomeration, in which case it will fail to realize its kinematic windfall potential.
- Starting from scratch, a new greenfield city will start off with almost no population initially. Even if there were immediate and uninterrupted exponential population growth from then on, it will still take decades for the new city to become a “megacity”, by which time the window of opportunity will have already passed, with the mid-century urban population surge and urban construction surge having already reached their peaks.
- Good greenfield sites are hard to find. A good site should have:
- enough land
- proximity to existing cities that are thriving
- proximity to ports and airports
“We are at the beginning of the next wave of urbanization — a period of rapid growth in both area and population… The next wave of urbanization will also be defined by its sheer size — a tripling of land cover in the first half of this century alone. While the carrying capacity of existing cities is under increasing strain, unsustainable urban growth threatens to outstrip any mitigation efforts in our urban cores. The result is a need for new sites of politics, housing, commerce, industry, and energy. One solution is the accelerating development of greenfield cities around the world. Building new cities from the ground up is a bold (and monumentally difficult) attempt to relieve the strain on our currently overloaded urban systems. It promises to build energy efficiency, sustainability, and resilience in to the core of a place.”40 — Caspar Herzberg, Schneider Electric
Network effect problems
Depending where construction happens, the Impossible Cities design faces one of two different network effect problems.
- Population growth network effects — for new greenfield city sites
- People move to cities because of the opportunities there, or because they know people there. The bigger the city, the more draw it has. Once a major city has become established, and has a critical mass, it’s not difficult to find people who want to move there. Kids are born and raised in existing cities, not in greenfield city sites. If a new town is founded from scratch, with a small population, in a remote place, then it probably doesn’t have enough critical mass to draw people to come live there. It’s a chicken-and-egg problem: in order to attract a lot of people, a city has to be big, but before it can become big, it has to have attracted a lot of people.
- A small-scale Impossible City would work just fine, and it would have some advantages over a similarly sized car-centric or transit-centric city. Lower transportation costs might be the largest single selling point. But the advantages may not be large enough to matter to anyone. For small-scale cities, car-centric designs actually work reasonably well, as do designs based on buses and bus rapid transit. The car & bus system only starts to break down once a city gets large enough to have serious traffic congestion problems, and it’s only at that scale that the Impossible City design starts to really outshine the other options.
- Transportation system network effects — for infill and suburb/satellite sites
- Different transportation systems tend not to be complementary.
- Dallas-Fort Worth is a car-based city. Cars work fairly well there, allowing millions of people to reach each other in under 30 minutes. Dallas-Fort Worth does also have a light rail system, DART, but it has less than 100,000 daily riders, because it only has 4 lines, with 64 stations, which means it doesn’t effectively connect any two points in the city. The network of car-based streets does connect any two points in the city. Free parking is available at more than half of the DART stations, but if you already have a car, and you’re already in your car, it may be faster and more convenient to just drive to your final destination, rather than drive to the DART station, park, wait for a train, pay a fare, ride the train, and then walk from the station to your destination.
- New York City, by contrast, has a subway system with 5 million daily riders, using 36 lines with 470 stations. In New York, the subway system works well because it has achieved critical mass, effectively connecting most points in the city. Cars also work in New York, but street congestion makes cars slow, and parking is a problem. In general, the car network & the subway network tend to be alternatives to each other, rather than being a unified system. The subway stations generally don’t have parking lots or taxi stands, and a trip will take longer if it involves both a car leg and a subway leg.
- An Impossible City design could be used to build a small-scale neighborhood in, or near, an existing car-centric city, either in an infill site or as a new suburb or satellite city. The problem with that scenario is that it may be the worst of both worlds: outside of the new neighborhood you have to use a car to get around, but within the new neighborhood there are no roads and no parking, so you can’t use a car. The Impossible bikeways would work well for trips within the new neighborhood, but not for any trips across town, crossing back and forth between the new neighborhood and the rest of the city. For trips across town, you still need a car and you still fight urban traffic congestion, but then you can’t drive right up to your office, and instead have to park somewhere at the edge of the kinematic neighborhood and then switch to foot or small vehicle to get the last distance. That means the trips would take longer because people would have to have both a car leg and a bikeway leg, with the need for parking and a transfer in between. In this situation, in terms of mobility and kinematic range, people would actually have been better off if the new neighborhood had been built to match the transportation system of the rest of the city, rather than introducing a new design.
- A more natural pairing would be small-scale Impossible neighborhoods centered on train stations for either subway trains, or light rail, or commuter trains like the San Francisco Bay Area Caltrain. That’s a workable design, but there may not be much opportunity for it in existing cities. In existing cities, the area around subway stops and train stations is typically already very developed, with expensive real estate, and expensive existing buildings, and lots of land reserved for streets, so that the remaining parcels are separated into islands. It would take a lot of time and money to try to rebuild a few square miles of that into a kinematic neighborhood.
Cost problems
Constructing even small buildings is expensive. Constructing entire neighborhoods or entire cities requires not just building housing and office space, but also building all the transportation infrastructure for roads, street lights, traffic lights, bus shelters, subway stops, and more. Plus all of the utility infrastructure, including sewers, water supply, power lines, telephone lines, and the rest.
- Low cost vs. high cost locations
- An Impossible City could be built in a high-cost location, such as California, or in a lower-cost location in a higher-growth area in India or Africa, like somewhere near the new Bagamoyo port and special economic zone, near Dar es Salaam, Tanzania. Starting in a lower-cost location is almost certainly a more promising approach, but it means that the benefits will be correspondingly lower. A 15% kinematic increase in wages & GDP is less dramatic if the wages & GDP were low to begin with, even if higher population growth and GDP per capita growth is expected.
- In a place like San Francisco or New York, average construction costs are about $350 per square foot. That means, for example, that new apartments can cost over $400,000 per unit to build.41,42
-
Even in the lowest-income countries, where construction labor is least expensive, the basic costs of steel and concrete amount to about $50 per square foot. That means even a very small single-room apartment can cost $5,000 to $10,000 in construction materials alone.16
“As of 2018, land prices near downtown Washington, D.C. and San Francisco were well over $10 million per acre, compared to around $100,000 per acre in Cleveland and Detroit.” 14
- Coordinated funding vs. parallel funding
- Real estate development projects have traditionally happened on the scale of one building at a time, or one small housing complex or office park at a time. A booming city may have hundreds or thousands of building projects going on in parallel, each with their own different land owner, general contractor, bank loan, and prospective tenant, and each with their own zoning and planning department approval. That arrangement lowers the bar for any single project, and enables lots of projects to move forward simultaneously, each at their own pace, without needing to coordinate tens of billions of dollars of funding and spending. Each project can be tuned to the needs of the particular parties involved, resulting a vibrant diversity of approaches and results, rather than the less successful giant mono-culture developments sometimes found in planned economies. For an Impossible City project to succeed, it would be necessary to try to let as many small projects as possible play out in parallel, but that requires first establishing a coordinated overall system that establishes a framework for zoning, planning, property ownership, infrastructure development, etc.
- In recent decades, the largest development projects in the world have been growing larger. Projects on the scale of $10 to $20 billion are now fairly common. Some of those are transportation infrastructure projects, such as the Chunnel, the Gotthard Base Tunnel, the Riyadh Metro, and the New York 2nd Avenue subway project. Others are more focused on creating large amounts of leasable square footage, such as Masdar City, or the Hudson Yards project in New York. However, when a single project has a $20 billion price tag, funding is still typically coordinated from multiple sources, usually with significant public funding in the mix. Notable exceptions are privately funded projects like the Apple Park campus in Cupertino, at $5 billion, or the City Center project in Las Vegas, at $11 billion, the largest privately funded construction project in the history of the United States.43 Any privately funded new city project would almost certainly need to have initial completion costs of no more than $10 or $20 billion.
- Upfront costs vs. ongoing costs
- Getting a new city started would be more feasible if it were possible to minimize the upfront costs, so that substantial costs only start to occur later, once people have already moved in, value is being created, and revenue opportunities are available. Unfortunately, the Impossible City design doesn’t lend itself to minimizing upfront costs. Because of the network effect problems, there’s not much incentive to try starting a small project; a more promising approach would be to try to scale up as quickly as possible, but that would require raising funds from speculative investors, rather than funding growth on revenue from the value created.
Bootstrapping problems
The problem of how to minimize upfront costs comes down to a bootstrapping problem, and amounts to a chicken-and-egg problem. A new city project doesn’t actually have to build a huge new city over night, but how do they create a minimum viable seed that’s large enough to spin up enough economic activity to propagate its own growth?
At a minimum, it seems like the project founders would need to:
- buy a huge amount of land on day one
- zone it all so that it can grow in a kinematic shape (without getting clogged up with junk like traffic lights and parking garages)
- find “anchor employers” to build majors project there, such as a port, a corporate headquarters, or a government capital
Building even a small seed of an Impossible City would take a long time and lot of resources. A minimum viable start might need:
- a city charter (the legal documents)
- an independent city government
- one or more corporate real estate development partners
- tens of square miles of fairly empty land
- it needs to be fairly empty, yet not remote
- it needs to be clear of conservation restrictions and legal show-stoppers
- existing local construction companies
- wholehearted support from existing county & state governments
- wholehearted support among the neighbors
- big “anchor employers” (like Amazon, or the Indonesian Government)
- a pent-up demand of people eager to move into new housing as it is completed
- a pent-up demand of companies eager to move into new office space as it is completed
- an existing airport, port, and interstate highway not too far away
- start-up capital:
- billions of dollars (in Africa)
- or tens of billions (in the US)
- existing construction firms & hundreds of experienced construction teams
- reliable supplies for millions of pounds of steel, concrete, and prefabricated parts
- a few years of time, for initial construction work, to build:
- enough housing and office space for tens of thousand of people
- covered laneways for vehicle circulation
- a power grid
- water supply
- a sanitation system
- other minimum basic infrastructure
Land value capture problems
Building good urban infrastructure, including transportation infrastructure, is extremely expensive. But in a city with good transportation infrastructure, the value created by the transportation infrastructure far exceeds the cost of the infrastructure.
- Value created
- Real estate values are higher in parts of the city that are closer to transit stations, and when new transit stations open the real estate values nearby rise.
- For example, when the new 2nd Avenue subway line in New York was built, property values along the subway corridor rose by 10% relative to the rest of the Upper East Side. It is estimated that total value of all that residential and commercial real estate rose by an additional $7 billion as a result of the subway line being built.44
- When the San Francisco Bay Area BART system built their Fremont extension, home values near the new station outpaced home values further away by a margin of about 9% to 15%, which amounted to an additional windfall of about $100,000 to $200,000 per home for all the homes within 2 miles of the new station, for an aggregate value of about $1.7 billion.
-
This is true not just for transit stations, but for any sort of access to transportation. For example, in Manhattan, corner lots are significantly more valuable than mid-block lots, and lots close proximity to Broadway also have higher values.37
“Based on the studies in Asian countries including China, Singapore and South Korea, public transportation generally has a positive impact on property values, and the impact is closely related with distance to the station. On average, property value will decrease by 1% if the distance from a transport station is increased by 10% (Cervero & Murakami, 2009).”45
“In most studies, proximity to transport stations has a positive correlation to land value. They can generate property value premiums ranging from 3% to 40% in different conditions (Medda, 2012).”45
- Privatized gains and socialized costs
- Unfortunately, the cost of the transportation infrastructure development is generally paid by governments, using public funds, while the value create is harvested by private property owners. This is similar to the problem of “privatized gains and socialized losses”. As a result, governments generally can’t afford to invest as much in transportation infrastructure as it would make sense to. Because of the disconnect between the investment costs and the return on investment, cities end up under-investing in mobility and kinematic range.
- The solution to this underinvestment problem is to structure the financial system to better connect the investment costs with the return on investment. This is not a new idea. For example, the Georgism movement dates back to the 1870s, when Henry George wrote his best-selling Progress and Poverty. One of the central ideas of Georgism is to tax land value, rather than tax labor.
- Land value capture
- With “value capture” or “land value capture”, the idea is to somehow set things up to recoup a big portion of the actual observed gain in land value that’s created by a given investment in transportation.45,44 Different cities around the world have tried different approaches to land value capture, including:
- simple property taxes or land value taxes (which may fail to capture much of the value created)
- tax increment financing (TIF), in places like New York
- leasing development rights to land, in places like Hong Kong
- With “value capture” or “land value capture”, the idea is to somehow set things up to recoup a big portion of the actual observed gain in land value that’s created by a given investment in transportation.45,44 Different cities around the world have tried different approaches to land value capture, including:
- Effective capture
- Some land value capture approaches are much less effective than others. The most effective approaches all have a few things in common:
- they tend to rely on good coordination of land use, city planning and economic development 45
- they don’t work as well in developed areas, and work better in undeveloped areas that have more room to grow 44
- they work in situations where the transportation developer can purchase land at a reasonable price45
- Some land value capture approaches are much less effective than others. The most effective approaches all have a few things in common:
- Catch-22
- That crux of the problem is that the place we really need better mobility is in existing big cities, but those are the places where all the land is already privately owned, it’s difficult to do much land value capture, and so it’s hard fund transportation infrastructure improvements. To add insult to injury, these existing big cities are also the places where transportation projects are the most expensive to do, working in tight spaces on complicated projects, with high labor costs and high real estate costs.
- Hong Kong
- Hong Kong stands out as a great example of successful land value capture and successful urban transportation investment. Hong Kong is a rare example of a city where public transport actually runs at a profit. 45
- Hong Kong is unusual, in that all land in the Hong Kong Special Administrative Region is state property (with the exception of St. John’s Cathedral), and has been since 1843. The land is available for use only through leasehold, not private ownership. The government is responsible for land management, development, and the leases to private parties. Private developers bid on an open market to lease parcels of land, typically with 50 years lease terms. 45
-
The government-owned Mass Transit Railway (MTR) Corporation acts as the master planner. It manages the whole real estate development cycle, all the way from drawing up plans, monitoring work quality, and managing the lease of completed projects.
“One reason that projects like Tsing Yi Station come into success is that the land use integration is evaluated at the master planning stage by MTR.”45
“Hong Kong’s strategy can be applied in cities where government owns the land.”45
- Depreciating licenses
- Hong Kong serves as an outstanding real world example, and in theory it should be possible to craft even more successful mechanisms for land value capture and urban transportation investment. There are many of avenues worth exploring here, and that’s beyond the scope of this paper. But, just as a single example, one promising idea for land value capture is the use of depreciating licenses, which can help to improve allocative efficiency. 46
“With the right framework, astonishing prosperity is possible. The independent city of Singapore overtook the world’s GDP per capita in less than 30 years, and that of the USA in less than 50 years.” 47
Possible vs. Impossible
| Possible | Impossible | |
|---|---|---|
| Vehicles needed (existing) |
||
| Construction technology (existing) |
||
| Location problems | ||
| Network effect problems | ||
| Cost problems | ||
| Bootstrapping problems | ||
| Land value capture problems |
FAQ, etc.
FAQ: Frequently Asked Questions
Could we build an Impossible City?
Yes. The Impossible City plans are designed with existing technology in mind, and with an eye toward simple, affordable technologies. It’s about bicycles and water pipes, not about floating ocean domes and orbital towers.
Where could we build an Impossible City?
Anywhere. The Impossible City design would work equally well in either low-income countries or high-income countries. The design would also work in any of the wide range of climates where existing cities are located. Here are some ideas about Hypothetical locations.
How much would it cost to build an Impossible City?
A fortune. In a high-income country, building construction costs might be something like $300 per square foot, with perhaps 600 square feet per person. So that’s about $200,000 per person, just for the construction of buildings, not counting land purchase costs, and not counting construction costs for infrastructure like sewers, dams, reservoirs, water treatment plants, airports, etc. Even in a low-income country, mid-rise building construction costs are likely to be at least $30 to $50 per square foot, with perhaps 150 square feet per person. That comes to at least $7,500 per person just for the construction of homes, shops and workplaces, not including land purchase and infrastructure construction.
How many people would live in an Impossible City?
Anywhere from 50 thousand to 50 million people. The Impossible City would work fine for a wide range of city sizes. The design does not make sense for small towns or villages, because the transportation system overhead is overkill for a town without any traffic problems. For cities of 50,000 or more the Impossible City design might offer some advantages over conventional designs. The Impossible City design begins to shine for cities of 4 million or more, offering better kinematic ranges than conventional cities. Impossible Cities with tens of millions of people would work well too, although they would need to also include subway systems or light rail systems.
How much indoor space would people have?
A normal amount, but not cavernous mansions. An Impossible City in California could have about the same amount of space per person as does a city like San Francisco, at roughly 600 square feet per person. An Impossible City in India could have an amount of space typical for that region, perhaps 150 square feet per person. But an Impossible City could not have a lot of cavernous mansions with thousands of square feet per person, because the transportation system would not work at those low population densities.
How much green space would people have?
A typical city amount, but not a typical suburban amount. An Impossible City in California could have about as much green space as does a city like San Francisco. But an Impossible City would not have single family houses each with their own front and back yards.
Could we turn London or Paris into an Impossible City?
No. Existing cities have a lot of physical infrastructure that’s expensive to change. People can make incremental changes, like adding new roads or bridges, but it’s not practical to change the fundamental layout and transportation network of an existing city.
Could Impossible City ideas trickle down to existing cities?
Yes. Over time people in existing cities like New York and San Francisco could adopt some of the ideas in the Impossible City designs, and make their cities incrementally more kinematic, even if they can’t change the fundamental layouts. One “simple” change would be re-stripe some of the lanes on some of the roads so as to split an existing automobile lane (at, say, 12 feet wide), into two side-by-side bicycle-sized vehicle lanes (at, say 6 feet wide each).
Do Impossible City ideas impact democracy and governance?
No. The Impossible City designs are politically neutral. The designs are only about transportation systems and about the physical, spatial layout of the buildings in the city.
An Impossible City could have a traditional city government structure, or it could experiment with less conventional structures. That’s a big topic, and one for another author. Suffice it to say, the questions of governance are largely orthogonal to the ideas presented here about the physical layout of a city, the transportation choices, etc. An authoritarian government could build an Impossible City, or a utopian libertarian collective could build an Impossible City, and they would both be Impossible Cities.
Rules of thumb
- People tend to travel about one hour a day.
- For people who commute, the average commute is about 30 minutes each way.
- For people who aren’t commuting, it is common to spend about an hour each day on other sorts of trips: chores, errands, appointments, etc.
- This “one hour per day” number has been found to be surprisingly consistent across different cities in different centuries, different cultures, and different continents, regardless of the different modes of travel used to commute. This is called the Marchetti constant (named for Cesare Marchetti, although it was really Yacov Zahavi who first wrote about it).
- As supply increases, consumption goes up.
- The Jevons paradox, or Jevons effect, says that if it becomes possible to use a resource more and more efficiently, then instead of using less of the resource, people actually use more. Total consumption increases because demand increases as efficiency drives the costs down.
- Induced demand says that as the supply of a resource increases, more of it will be consumed. If you add a new lane to a congested highway, it does not result in reduced congestion and faster trips, but instead results in an increase in the total number of trips made. Induced demand might be better described as latent demand. The demand was actually there all along, there was just a lack of supply to meet the demand. The concept of induced demand is often used as an argument against increasing roadway traffic capacity. I think this is misguided. The existence of latent demand is a sign that we should be striving to increase the supply of transportation capacity, and increase Kinematic Range.48
- Some aspects of a city scale linearly.
- If a city doubles in population size, many measurable characteristics of the city, such as the number of businesses, also double in size. Around the world, from small towns to big cities, regardless of the size of city, there’s always about one business establishment per 22 people, and an average of about 8 employees for each establishment.7
- Some aspects of a city scale sub-linearly.
- There are often economies of scale in the infrastructure of big cities (or at least, economies of density).
- If a city doubles in population size, meaning it grows by 100%, parts of the supporting infrastructure tend to only grow by 85%. This is tends to be true for networks of roads, electrical cables, and municipal sewers and water pipes.
- Some aspects of a city scale super-linearly.
- Superlinear scaling is the phenomenon where if a city population grows by 100% (meaning it doubles in population size), then the economy of the city tends to grow by about 115% (meaning it more than doubles in size), so that there is effectively a 15% “bonus” in per capita economic output for everyone in the city.7 This 15% superlinear growth seems to apply to the whole physical and social metabolism of the city, rather than just the economic aspects of the city. The 15% surplus shows up in statistics about:
- wages
- wealth
- patents
- AIDS cases
- crime
- restaurants
- variety of business services available (meaning, how long the “long tail” of the city is)
“It’s illuminating to ask how many different types of businesses there are in a city. … The data confirm that diversity systematically increases with population size. … an extrapolation of the data strongly suggests that if we could measure diversity to the finest possible resolution it would scale logarithmically with city size.”7 — Geoffrey West
- Superlinear scaling is the phenomenon where if a city population grows by 100% (meaning it doubles in population size), then the economy of the city tends to grow by about 115% (meaning it more than doubles in size), so that there is effectively a 15% “bonus” in per capita economic output for everyone in the city.7 This 15% superlinear growth seems to apply to the whole physical and social metabolism of the city, rather than just the economic aspects of the city. The 15% surplus shows up in statistics about:
| City Population | Average Hourly Wage (this is not actual observed data, just example numbers) |
Superlinear Scale Factor |
|---|---|---|
| 40,000 | $16 | (-15%)^4 below $28 |
| 80,000 | $18 | (-15%)^3 below $28 |
| 160,000 | $21 | (-15%)^2 below $28 |
| 320,000 | $24 | -15% below $28 |
| 640,000 | $28 | 100% average |
| 1.25 million | $32 | +15% above $28 |
| 2.5 million | $37 | (+15%)^2 above $28 |
| 5 million | $43 | (+15%)^3 above $28 |
| 10 million | $49 | (+15%)^4 above $28 |
Economic literature linking the wealth of cities to spatial concentrations is quite abundant and is no longer controversial in academic circles. … The 2009 World Bank Development Report “Reshaping Economic Geography,” and the report of the Commission on Growth and Development “Urbanization and Growth” (published the same year) exhaustively summarize and document the theoretical and empirical arguments justifying the economic advantage provided by the spatial concentration of economic activities in large cities.16 — Alain Bertaud
“High-tech invention is extraordinarily concentrated in just a handful of cities. … The top 10 city-regions account for nearly 60 percent of inventors in biology, chemistry and medicine, with greater New York and the San Francisco Bay Area accounting for more than 10 percent each. Seventy percent of inventors in computer science are in the top 10 regions; the Bay Area alone has more than one-quarter of them. And the top 10 regions account for almost 80 percent of inventors in semiconductors, with one-quarter again in the Bay Area and another 15 percent in greater New York.” … “This clustering of inventors has only increased over time, growing by about five percentage points for biology, chemistry, and medicine, 15 percentage points for computer science, and about 20 percentage points for semiconductors between 1971 and 2007.”8
-
Sublinear growth (economies of scale) is the phenomenon where if a city population grows by 100% (meaning it doubles in population size), then the network of roads, electrical cables, and other supporting infrastructure of the city tends to grow by about 85% (meaning it less than doubles in size), so that there is effectively a 15% “bonus” economy of scale, both economically and environmentally.7
“Once one starts to think about (the causes of economic growth), it is hard to think about anything else.” — Robert Lucas, Nobel laureate in Economics
Effective altruism
Effective altruism is the idea of trying to find the most cost-effective interventions for improving global well-being, and then directing money and resources towards those efforts. Non-profit research organizations like GiveWell(link) work hard to evaluate wide arrays of possible interventions and try to find the most effective ones. Private foundations like the Gates Foundation have similar internal research departments.
The idea of building Impossible Cities might be worth studying as a candidate intervention for effective altruism. Building cities is far more expensive than most philanthropic interventions, but it also has the potential for a variety of simultaneous large-scale positive outcomes.
- Basic housing
- Housing is a basic human need. Non-profits like Habitat for Humanity focus on housing construction. Other non-profits run homeless shelters, promote “Housing First” housing, provide affordable housing & emergency housing, set up refugee camps, etc. An Impossible City built on the outskirts of Dar es Salaam, for example, would be in the midst of a population where one-third of the people are malnourished and two-thirds of are living below a poverty level of $1.25 per day. An Impossible City project like this could serve as a large-scale intervention to provide basic housing to a population in need, while also providing a large amount of market-rate housing.
- Sewer & water systems
- More than half the world’s population lacks adequate access to clean water, toilets, and good sanitation systems. Inadequate sanitation is estimated to kill hundreds of thousands of people per year. Organizations like the Gates Foundation are working hard on providing sanitation, and they report that every dollar spent on sanitation is estimated to provide at least five dollars in economic return. For a new Impossible City built for underserved populations, the city’s sewer and sanitation system alone would be a significant philanthropic intervention.
- Poverty intervention
- If the Impossible City design does prove to help reduce kinematic lag, and if a new Impossible City is seeded in a location where it will grow large, then the kinematics of the design itself should serve as a powerful anti-poverty intervention. The Impossible City construction should be slightly less expensive than traditional urban housing & transportation systems, so the kinematic benefits come essentially “for free”, simply as a result of the geometry of the streets and buildings.
- Climate change intervention
- The Impossible City design offers a low-carbon approach to large-scale 21st century development. Building even a single, small-scale Impossible neighborhood could serve as a proof-of-concept and study model for further developments. Early funding for an initial prototype development might have a disproportionately high impact, in the same way that successful research & development efforts can sometimes have high impact per dollar invested.
- Disaster relief
- The Impossible City design lends itself to being built quickly, because of the simplicity of the design. If necessary, an Impossible City could be completely built and fully functional even without any traffic lights, elevators, buses, HVAC systems, windows, or central power grid. Better still would be to already have some excess capacity of half-built cities on hand before disaster strikes.
- In the decades to come large-scale disasters will come more frequently, as cities get bigger, weather events get more severe, and sea levels rise. The disasters will increasingly require large-scale refugee housing on short notice. In addition to natural earthquakes and tsunamis, there will be an increasing number of climate-related disasters:
- wildfires, like the 2018 California fires and the 2019-2020 Australian Black Summer bushfires
- flooding events, like the 2013 and 2016 Indian floods
- levee failures, like the 2005 New Orleans flood wall failures
- typhoons, like China’s 1975 Typhoon Nina
- mud-slides, like Venezuela’s 1999 Vargas mud-slide
- heat waves, like the 2003 and 2006 European heat waves
- Education
- There are significant urban-vs-rural disparities in the quality of education that kids receive. Non-profits and governments try to address that problem as best they can, by, for example, incentivising teachers to move to rural villages. But that only goes so far. Rural kids will still, on average, be further away from a school, have fewer school & class choices, and have less exposure to large pool of educated, literate adults working in a variety of professions (for example: doctors, nurses, clergy, mechanics, and engineers).
- By making urban housing more affordable, the Impossible City design would help enable more people to move from rural to urban settings, and result in more kids having the advantages and opportunities of an urban environment.
- Women’s rights
- There are also significant urban-vs-rural disparities in women’s rights. The UN reports that, with few exceptions, rural women fare worse than urban women for each of the Millennium Development Goal (MDG) indicators. Women and girls in urban settings have more access to education, health care, and family planning services, and more access to jobs and support services.
- The Impossible City design goes a step further than conventional cities, by decreasing barriers to mobility. There’s no silver bullet for preventing sexual assault and harassment, but the Impossible City design can enable people, including women & girls, to travel through a significantly larger chunk of city without having to wait at night at bus stops, walk through subway tunnels, or ride in taxis or Uber cars. The Impossible City design helps provide equal access to mobility and kinematic range, which in turn helps provide equal access to all the opportunities that fall within that kinematic range.
- Family planning intervention
- There are significant urban-vs-rural disparities in women’s ability to choose how many children to have. Across a range of countries, rural fertility levels are significantly higher than urban levels. Part of the urban-rural fertility gap can be attributed to demographic differences in things like income levels and education levels. But even after adjusting for demographic differences, a significant portion of the fertility gap appears to be attributable to the setting itself, urban vs. rural. Rural fertility is almost 20 percent higher than urban fertility, for matched cohorts.49
- An Impossible City project would add to the supply of urban space, help meet unmet demand for urban housing, and by accelerating the ongoing urban-rural demographic transition, would help provide more individual choice in family planning decisions while also helping to reduce the population pressure that we collectively are putting on the planet, as the global human population swells from the current 7.8 billion up to something like 9.7 or 9.8 billion by 2050.
Appendixes
- Books and software
- Glossary
- Hypothetical locations
- Impossible City design summary
- Source material
- References
Books & software
Books
-
Carfree Cities, by J.H. Crawford
-
Order without Design: How Markets Shape Cities, by Alain Bertaud
-
Scale, by Geoffrey West
-
Soft City, by David Sim
-
Velotopia, by Steven Fleming
-
Urban Bikeway Design Guide, and the other street design guides, by the The National Association of City Transportation Officials (NACTO)
Software Tools
-
Brookings: metropolitan area “nearby jobs” maps: An interactive web page with maps showing heat-maps of the number of nearby jobs in different United States metropolitan areas. See also: “The growing distance between people and jobs in metropolitan America”.
-
OnTheMap: An interactive web page with maps showing information about workplaces, jobs, and commute distances for any the United States city, county, census track, or user-defined area.
-
Sidewalk Widths NCY: An interactive web page with a map showing the width of the sidewalk of each city block in New York.
-
Streetmix: An interactive web page where you can design and redesign different street layouts, making different choices for street & lane widths, lane-use types, sidewalks, parking, etc.
-
SUMO: Simulation of Urban MObility. An open source traffic simulation package designed to handle large road networks.
-
TravelTime platform, by iGeolise, Ltd
Glossary
- agglomeration economies
- The idea of agglomeration economies is similar to the separate idea of “economies of scale”. Agglomeration economies are the economic benefits that come from “industrial agglomeration”, which means the clustering of a lot of business firms in one region. (Our designs to be mindful of avoiding “agglomeration diseconomies”, which are the disadvantages of proximity, such as traffic congestion.)
- architectural, engineering and construction (AEC)
- the entire industry of companies and people who build structures
- build-operate-transfer (BOT) agreement
- an agreement where a private company or consortium builds and operates some new project or facility (such as an airport or a sewer system) for a set amount of time (such as 30 years), after which ownership of the whole facility is transferred back to the government
- building information modeling (BIM)
- instead of old 2D paper blueprints for architectural designs, BIM uses digital models of buildings, where the models include not only the 3D geometry of the building, but also information about specific part numbers for components, costs, sustainability analysis information, etc.
- charter city
- a special jurisdiction with a blank slate in commercial law, to allow for the adoption of new practices in areas such as a business registration, labor law, tax administration, and commercial dispute resolution
- typically built on greenfield sites to avoid the challenges of implementing such a wide array of reforms in an existing polity
- typically privately financed
- see: special economic zone
- co-design
- an design approach where stakeholders and end users are partners in the design process
- community land trust (CLT)
- A nonprofit organization that owns land and sells or rents housing units (or retail or office space) built on the land, usually with the goal of providing affordable housing. A household typically leases a unit for a 99-year term, rather than buying a house outright, or may buy a house outright but leases the land that the house built on. Members elect a board so that the CLT is democratically self-governing. When a member sells a unit, the CLT may collect a cut of the sales price (in practice, as high as 75%), which it can use to subside purchases for new homeowners. 50
- curb-cut effect
- systems designed to benefit vulnerable groups, such as the disabled, often end up benefiting all of society
- effective altruism
- using empirical analysis to direct resources towards efforts that do the most possible good
- anti-malaria efforts, deworming initiatives, and direct cash transfer programs are among the interventions most widely credited with providing the most cost-effective improvement in welfare for the global poor than any other intervention
- see GiveWell
- generative design
- a design process in which a computer generates a large number of possible solutions, and iterates towards more optimal designs, based on sets of constraints and design evaluation criteria
- global compact on refugees (GCR)
- a 2018 United Nations draft agreement on refugees
- global compact on safe, orderly and regular migration (GCM)
- a 2018 United Nations agreement about international migration 51
- greenfield city
- a greenfield project is a project that starts from scratch and is unconstrainted by having to fit within a framework established by prior work, and a greenfield city is a city development project built on a greenfield site of previously undeveloped land
- Harberger tax
- a property tax system in which a property owner declares a self-assessed value for their own property, pays tax as a percentage of that value, and agrees to immediately sell the property to any buyer who offers the self-assessed value
- High Line
- an greenway park in New York City, built as a rails-to-trails conversion of a section of elevated railway, inspired by the Promenade plantée in Paris
- housing cooperative or housing co-op
- A group of households in a multi-family building, where each household owns a share of the whole building co-op and has the right to occupy a single unit, rather than owning that unit outright. An elected board makes decisions. 50
- inclusionary zoning
- city zoning restrictions that requires (or incentivizes) private developers to private some portion of the units in a new building at a below market rate
- induced demand
- if you add lanes to a freeway, it leads to more trips, not faster trips 48
- industrial agglomeration
- isochrone map
- a map with concentric isochrone lines around a center location, where all the points on any given line represent places that are equally distant, in terms of travel time, from the center location 52
- Jevons paradox
- as X gets faster (and cheaper), people use more X 53
- kinematic
- concerned with the motion of bodies, and their range of motion
- kinematic range (KR)
- as a measure of urban mobility, the number of destinations (jobs, schools, friends) that you can get to in a given amount of time
- kinematic range30-minute (KR30)
- the number of destinations you can get to in 30 minutes of travel time
- land value capture
- any method whereby a city or other community arranges to fund infrasucture development (such as a subway system) by recovering and reinvesting the increases in land value that result from public investment
- limited equity housing co-op
- a type of co-op building, owned collectively by the residents, available only to low-income or moderate-income buyers, at below-market buy-in prices, and with restrictions on resale that limit the profit that members can make when they sell
- long tail
- On Amazon, some popular books, like Harry Potter books, sell lots of copies. An obscure book may sell almost no copies, but there are lots of different obscure books, and togther the obscure titles sell more copies than the popular ones. Some statistical distributions, like the one that describes Amazon book sales, have a “long tail”, which means that the uncommon items, when taken together, end up being just as significant as the common items, or more so. If a book seller sold all the popular titles but no unpopular ones, they would be failing to meet most of the demand for books. Similarly, if the city bus routes go to all of the popular destinations, but nowhere else, then they fail to meet most of the demand for mobility. (Picture by Hay Kranen.)
- Marchetti constant
- People will commute about 30 minutes each way per day
- The Marchetti constant says that people tend to travel about one hour a day. The Marchetti constant is named for Cesare Marchetti, although it was really Yacov Zahavi who first wrote about it.
- For people that commute to a job, the average commute is about 30 minutes each way. For people who aren’t commuting, it is common to spend about an hour each day on other sorts of trips: chores, errands, appointments, etc.
In the United States in 2013, commuting trips represented only 20 percent of weekday urban trips, 28 percent of vehicle kilometers traveled, and 39 percent of public transport passenger-kilometer traveled.16
The one-hour number seems to be surprisingly consistent across different cities in different centuries, different cultures, and different continents, regardless of the different modes of travel used to commute. The one-hour constant is believed to have held true in:
- Ancient Rome
- Medieval Paris
- Victorian London — steam train
- New York — subway
- Los Angeles — car
“Using data from cities across several countries, including the United States, England, Germany, and some developing nations, [Yacov] Zahavi discovered the surprising result that the total amount of time an average individual spends on travel each day is approximately the same regardless of the city size or the mode of transportation. … we tend to spend about an hour each day traveling, whoever and wherever we are. … the average commute time from home to work is about half an hour each way independent of the city or the means of transportation.
… the increase in transportation speed resulting from the marvelous innovations of the past couple of hundred years has not been used to reduce commuting time but instead has been used to increase commuting distances. … the size of cities has to some degree been determined by the efficiency of their transportation systems for delivering people to their workplaces in not much more than half an hour’s time.”7 — Geoffrey West
-
- floor area — the amount of floorspace in a building, including the floorspace on all the different floors of a multi-story building.
- gross floor area — the total floor area of a building, including all the area taken up by lobbies, hallways, elevator shafts, walls, offices, apartments, etc.
- usable floor area — the subset of the gross floor area that could be rented out to be used exclusively by a tenant, or sold for the exclusive use of an owner (for example, a studio apartment, or a dentist’s office).
- occupied floor area — the subset of the usable floor area that is being used, not sitting vacant.
- circulation area — for a building, the floor area of a building taken up by hallways, elevator shafts, stairways, and lobbies. (Or, for a city, the additional land area taken up by streets and sidewalks, parking lots, driveways, bus stops, train tracks, etc.)
- floor area ratio (FAR)
- FARparcel — the floor area ratio for a building on a parcel, meaning the ratio of floor area to parcel area.
- FARoverall — the floor area ratio for a neighborhood of a city, meaning the ratio of the total floor area of all the buildings to the total land area of the neighborhood, including all the land area used for streets and sidewalks and parks, as well as the land area of all the parcel area.
- circulation area ratio — the ratio of the total circulation area of a city to the total usable floor area. In New York City, for typical Manhattan city blocks, the streets and sidewalks take up 30% of the land area, with the remaining 70% available for building parcels. Within an office building, hallways, stairs, and elevators typically take up 30% of the floor area of the building, leaving only the remaining 70% as usable floor area.
-
GDP per capita
-
kinematic ranget=30_minutes — the total amount of occupied floor area a person could possibly get to in 30 minutes.
- kinematic range (KR) — the total amount of occupied floor area a person could possibly get to in some fixed amount of time. KR is a measure of mobility, and a measure of the capacity and efficiency of a transportation network. The KR measure serves a proxy represents the range of destinations that a person can get to. In the real world, a destination would be something like your friend’s house, your dentist’s office, or a library or coffee shop.
- factors: kinematic range is a function of lots of different factors:
- starting location — are you starting at the center of town, or out at the edge?
- urban density — how many destinations are there per square mile?
- mode of transport — are you walking, or in a car?
- encumbrances — do you have a stroller, or a wheelchair?
- age, race, & gender — can you safely take the subway, or do you need to take a cab?
- time of day — are the trains even running at this hour?
- traffic congestion
- travel bans & security checkpoints — are you allowed into that area?
- factors: kinematic range is a function of lots of different factors:
-
land area — the total size of all the land occupied by a city.
-
parcel area — the size of the lot of land that a house (or other building) is built on.
- population density — the number of people per land area. Alternatively, you can also think about density in terms of floor area per person.
- floor area — the amount of floorspace in a building, including the floorspace on all the different floors of a multi-story building.
- new urban agenda (NUA)
- a 2016 United Nations agreement serving as a guideline for global urban development from 2016 to 2036 54
- refugee city
- a proposal for a type of special economic zone (SEZ) for displaced people 55
- see also: sustainable development zone (SDZ)
- special economic zone (SEZ)
- sustainable development zone (SDZ)
- a proposal for designated areas that are designed to promote economic development via a combination of governance and physical infrastructure, in economies composed of displaced people 58
- see also: refugee city
- tax increment financing (TIF)
- special tax districts around targeted redevelopment areas, where future tax revenues are diverted to finance infrastructure improvements or development 59
- transportation poverty
- poor access to transportation, which can result from a variety of contributing factors, such as: areas where most housing is far from a bus or railway line, areas where housing is far from goods and services, and areas where average incomes make it expensive to own and operate a car
- urban consolidation center (UCC)
- neighborhood-level freight hubs, place around the edge of a town, where trucks or large vehicles drop off packages to be loaded into small vehicles, like electric cargo bikes, for last-mile delivery
Hypothetical locations
Just as a thought experiment, it can be interesting to look at regions of existing cities and think about which places might be large enough to sustain a new car-free kinematic district…
Treasure Island, near San Francisco
Question: Would a site like Treasure Island (including Yerba Buena Island) be a suitable test site for a new neighborhood with an Impossible City design? It’s about 2.5 square kilometers, but currently only has a population of about 2,500?
Answer: No, Treasure Island is too small. Also too remote – being entirely surrounded by water is a loss in terms of commute times and ranges. Ferries are slow. Cars are subject to all the existing traffic congestion. A BART extension would cost billions, and perhaps tens of billions. Potentially that BART extension alone would be more expensive than an entire seed neighborhood on a 50-square mile greenfield site.
Treasure Island would certainly have huge market demand. Every apartment you built would rent for thousands of dollars a month. But buying all the land on Treasure Island, at market prices, would cost you billions. And construction costs would be $500 per square foot, so even once you owned the island, it would still cost $400,000 per apartment to build housing. If you built office space too, and high schools, and police stations, pretty soon you’ve got a construction budget up over ten billion for this “small scale” starter project!
In contrast, buying 50 square miles in a satellite location on the outskirts of a city in Africa could be relatively affordable, and you might be met with a warmer welcome in the whole multi-year design review & permitting process.
Brisbane, California
Brisbane Baylands would be a better site than Treasure Island. The city of Brisbane, just south of San Francisco, does have a large undeveloped parcel that would be big enough to build a bit of an Impossible City in.
Brisbane Baylands has slightly more land area than Treasure Island, and there’s no new construction work already underway like Treasure Island has. Plus the Caltrain commuter train and highway 101 run right through Brisbane Baylands, and a Muni light rail station is there. It’s also immediately adjacent to San Francisco, with no bridge crossing or ferry required.
Brisbane Baylands already has a private land owner and private developer that want to build on it. It could be a great location for a kinematic district, but only if the voters in Brisbane wanted denser development, which they don’t.
Stanford University, California
The Stanford University campus, at 13 square miles, is more than an order of magnitude larger than Treasure Island and would be a candidate for a new Impossible City district. It’s also already situated in a developed urban area, with good connectivity to highways 101 and 280, Caltrain, and two existing international airports. And, unlike Treasure Island, it’s not surrounded by water, which means all the area immediately around it falls into its kinematic range.
But for Stanford to work as a location, people would have to be willing to tear down some of what’s already built there. And the whole project would only be possible in some very like scenario where the city of Palo Alto were willing welcome hundreds of thousands of new neighbors, with all the strain that would bring on already congested highways, airports, and train lines.
Other San Francisco Bay Area sites
There are other sites all around the Bay Area that are big enough and well located, if it were possible to get approval to build densely on them. Half Moon Bay, Pescadero, or, oddly, the huge empty space right in middle of the Bay itself, north of the Dumbarton bridge and south of the 92 bridge, which in many ways would be nearly perfect, except for the fact that construction in the Bay is completely off limits, given its status as a protected nature reserve.
The Sea Ranch, California
Further afield, there’s the Sea Ranch. It has more land area than the Stanford Campus, but with a population of only 1,300 people, so there is only a small pool of existing owners to buy out, and a small number of buildings to be moved, removed, or incorporated into the new plans. The weather is great, the views are great, the hiking is great. But it’s remote: it’s only got a tiny airport, and no port, no rail, no major highway. I think it would only really work in some science fiction scenario where you could build a hyperloop tunnel to San Francisco and Silicon Valley.
Northern California Coast
There are other similar sites up the California coast, like in the Eureka area, with similar pros and cons. Or the area around the Little River Airport by Mendocino, if the State of California suddenly decided to allow development in the State Park property.
The Northern California Coast is one of a number of unusual places in the world. For some sorts of development projects, it might prove to be a “Goldilocks” location, with a rare collection of attributes:
- coastal location that could have sea ports
- within a couple hundred miles of the established, thriving, high-GDP urban agglomeration (the San Francisco Bay Area), which has significant unmet demand for housing, office space, and manufacturing space
- low population density, with large, empty counties that average just a few dozen people per square mile across thousands of square miles
- low land prices
- enjoys a moderate, Mediterranean climate (no need for air conditioning, only mild needs for heating, and no need to protect plumbing from winter freezes)
- projected to still have a moderate climate even in 2050 or 2100, after significant global warming makes many other places either too hot, too dry, or too prone to severe storms and flooding
- latitude within 45 degrees of the equator, with adequate sunshine and non-extreme seasonable variation in daylight hours
- stable legal environment with fairly predictable rule of law
Greenfield locations
Alternatively, instead of looking at locations in places like California, it might be easier, faster, and more fruitful to work with people who are already in the process of planning large new developments on open greenfield sites, the way people are doing in Asia, Africa, and the Middle East.
Fast-growing locations
The best locations might be ones that are close to the cities that are expected to grow the most dramatically in the coming decades and have very large populations by 2050:
| City | 25-year growth projection |
25-year growth % |
2050 population projection 30,60 |
2025 population projection 60 |
|---|---|---|---|---|
| Kinshasa, DRC | 18 million | 109% | 35 million | 17 million |
| Lagos, Nigeria | 17 million | 107% | 33 million | 16 million |
| Mumbai, India | 16 million | 61% | 42 million | 26 million |
| Delhi, India | 14 million | 61% | 36 million | 23 million |
| Dhaka, Bangladesh | 13 million | 60% | 35 million | 22 million |
| Karachi, Pakistan | 13 million | 66% | 32 million | 19 million |
| Kolkata (Calcutta), India | 12 million | 61% | 33 million | 21 million |
| Dar es Salaam, Tanzania | 10 million | 181% | 16 million | 6 million |
| Kabul, Afghanistan | 10 million | 138% | 17 million | 7 million |
| Manila, Philippines | 9 million | 59% | 24 million | 15 million |
| Cairo, Egypt | 8 million | 54% | 24 million | 16 million |
| Nairobi, Kenya | 8 million | 143% | 14 million | 6 million |
| Khartoum, Sudan | 8 million | 102% | 16 million | 8 million |
| Baghdad, Iraq | 7 million | 87% | 15 million | 8 million |
| Chennai (Madras), India | 6 million | 61% | 16 million | 10 million |
| Lahore, Pakistan | 6 million | 53% | 17 million | 11 million |
| Luanda, Angola | 6 million | 74% | 14 million | 8 million |
| Bangalore, India | 6 million | 61% | 16 million | 10 million |
| Hyderabad, India | 6 million | 61% | 15 million | 9 million |
Impossible City design summary
Transportation
The Impossible City design calls for:
- no cars within city limits
- no private cars
- no taxis
- no ubers, lyfts
- no waymos and self-driving cars
- no rail within city limits
- no subways
- no light rail
- no trollies or trams
- nothing airborne within city limits
- no delivery drones
- no helicopters
- no gondolas
- nothing big
- no buses or bus rapid transit (BRT)
- no trucks
- no mass transit
- no gas engines in vehicles
- no motorcycles
- nothing fast
- no motorcycles
- no stops — keep traffic flowing
- no traffic lights
- no stop signs
- no large intersections
- no personal rapid transit, pods, people movers, or things with fixed stops
- no freeways, and no free roads
Instead, the design has:
- bike-sized vehicles
- mixed-use vehicles
- Some people may own their own bikes, wheelchairs, or other vehicles, which they can park at home or in parking spaces at their destination.
- Some people may choose not to own their own vehicles, and instead use vehicle rental services such as Mobike, Lime, Motivate, or JUMP Bikes.
- Some people may choose to travel in pedicabs or other small vehicles that have a human driver or are self-driving.
- Innovation is NOT REQUIRED
- An Impossible City could be built today using off-the-shelf bikes and other vehicles purchased from amazon.com.
- Innovation IS POSSIBLE — an Impossible City can incorporate new products as they emerge on the market, such as
- new models of electric bikes, scooters, etc.
- scooters and bicycles that can autonomously reposition themselves from where they are left to where they are needed. (Companies like Tortoise and Uber are working on autonomous scooters.61)
- small vehicles that are fully self-driving, like self-driving wheelchairs, go-karts, or other single-person vehicles
- wireless charging stations at public parking spaces
- automated congestion pricing
- battery swapping services
- mixed-use vehicles
- covered laneways
- rain-sheltered pedestrian sidewalks
- rain-sheltered bike-sized lanes — 5-foot wide lanes, not 10’ or 12’ wide car lines
- laneway tolls & parking tolls
- no tolls on laneways that aren’t congested
- highest tolls at rush-hour, or on busy laneways
- tolls are per-minute, not per-mile (to prevent slow “street blimp” advertising vehicles)
- free parking when space is ample
- highest parking tolls in congested areas
- common-carrier delivery lockers62
- package-delivery lockers, located along the laneways
- shared by Amazon, FedEx, UPS, USPS, and anyone else who would like to use them
Spatial layout proposal
A Impossible City design has:
- no highways
- no roads with lanes wide enough for cars and trucks
- no empty rooftops
- no single-story buildings such as ranch houses — (don’t squander land area)
- no skyscrapers and no high-rise residential buildings — (keep construction costs down)
- no private suburban lawns
Instead, it has:
- mid-rise buildings of about six stories, similar to Paris
- row-houses and “walk-up” apartments
- buildings spaced to avoid dark areas that would be far from windows and skylights — (keep lighting costs down)
- buildings with ventilation chimneys — (keep HVAC costs down)
- buildings with windows that open
- a grid of bike-sized boulevards
- rain-sheltered boulevards, each with four narrow bike-sized lanes, each 5 feet wide, plus shoulders
- grade-separated intersections, so your entire commute has no stop signs or traffic lights
- a grid of highline trails above the bike boulevards
- city blocks of about 660 feet by 660 feet
- about one iconic landmark structure per million people, inspired by examples such as:
- the Eiffel Tower in Paris
- St. Basil’s Cathedral in Moscow
- Big Ben and the tower from the Palace of Westminster in London
- the leaning tower of Pisa
- the Space Needle in Seattle
- the Tower Bridge in London
- the Makkah Royal Clock Tower in Mecca
- the Gateway Arch in St. Louis
- Potola Palace in Lhasa, Tibet
- Westminster Abbey in London
- Le Mont-Saint Michel
- the pyramids of Giza
- Chateau Frontenac in Quebec
Ramp proposal
Optionally, an Impossible City could have:
- no stairways, no stairs, and no steps — (don’t squander floor space)
- no elevators — (at $100,000 or more each)
- no escalators
In this scenario, the only way to go “upstairs” or “downstairs” in an Impossible City would be by using:
- flights of wheelchair ramps
- hallway ramps
- sidewalk ramps
- bike path ramps
The idea of having no stairs and no elevators sounds crazy to most people when they first hear it, because it’s so different from all the normal buildings and cities that we’re used to.
However, if you run the numbers, and run simulations, it turns out that getting rid of elevators and stairs works out just fine. Instead of making it harder to get places, having no elevators makes it faster to get between any two random locations.
The Impossible City ramp-only design:
- is faster and more convenient for people in wheelchairs, and people with strollers
- is faster for everybody else too
- works better for delivery robots
- works better after a natural disaster
- takes up less space in the building
In the Seagram building (which has 38 floors), the area used for elevators and utility shafts occupies 31 percent of the area of a typical floor.16
- can be built more quickly
- is less expensive to build
- is less expensive to operate
- is less expensive to maintain
- has a smaller carbon footprint
“Lifts also use a large amount of energy to run. For buildings that are largely served by lifts, you can add a rough figure of 5 to 15 per cent onto building energy running costs.”13 — Susan Roaf
Safety proposal
An Impossible City could have:
- no gas lines
- no telephone poles
- no overhead power lines
Instead, it would have:
- underground power lines
- underground telephone lines
Source material, chaper 1
Throughput per lane (source: NACTO63)
| Throughput | Width | Mode |
|---|---|---|
| people per hour | ||
| 600 to 1,600 | one lane, 3 meters wide | private motor vehicles |
| 1,000 to 2,800 | one lane, 3 meters wide | mixed traffic with frequent buses |
| 6,500 to 7,500 | one lane, 3 meters wide | two-way protected bikeway |
| 4,000 to 8,000 | one lane, 3 meters wide | dedicated transit lanes |
| 8,000 to 9,000 | one lane, 3 meters wide | sidewalk |
| 10,000 to 25,000 | one lane, 3 meters wide | on-street transitway, bus or rail |
Throughput per lane (source: Bertaud16)
| Throughput | Vehicle type |
|---|---|
| passengers per hour per lane at about 15 km/h |
|
| 1,000 | Bus, M1: 5 minutes headway |
| 1,600 | cars |
| 2,600 | Bus 4 routes: 1 minute 48 seconds headway |
| 2,800 | motorcycles |
| 5,500 | bicycles on entire lane width |
Width per 10,000 throughput (source: NACTO64)
| Throughput | Width | Mode |
|---|---|---|
| people per hour | ||
| 10,000 | one lane, 12’ to 15’ wide | sidewalk |
| 10,000 | one lane, 12’ to 15’ wide | protected bike lane |
| 10,000 | two lanes, totaling about 23’ wide | bus-only lanes, with 80 buses per lane per hour |
| 10,000 | 13 lanes of conventional arterial, at about 156’ wide | mostly cars, with 800 vehicles per lane per hour |
Car speeds
“cars in the busiest parts of Manhattan now move just above a jogger’s pace, about 7 m.p.h., roughly 23 percent slower than at the beginning of the decade.” 3
Pedestrian speeds
“the average human walking speed at crosswalks is about 5.0 kilometres per hour (km/h), or about 1.4 meters per second (m/s), or about 3.1 miles per hour (mph). Specific studies have found pedestrian walking speeds at crosswalks ranging from 4.51 kilometres per hour (2.80 mph) to 4.75 kilometres per hour (2.95 mph) for older individuals and from 5.32 kilometres per hour (3.31 mph) to 5.43 kilometres per hour (3.37 mph) for younger individuals” 65
- walking speed: 2.17 mph up a 1:12 ADA ramp
- walking speed: 2.6 mph UP or DOWN an 1:12 ADA ramp 66
| Walking speeds per horizontal distance67 |
|||||
|---|---|---|---|---|---|
| Stair gradient |
Grade | Up stairs | Down stairs | Up stairs | Down stairs |
| (degrees) | (rise:run) | over 50 | age 30 to 50 | over 50 | age 30 to 50 |
| 38.8 | 80:100 | 0.435 m/s | 0.485 m/s | 0.47 m/s | 0.59 m/s |
| 35.0 | 70:100 | 0.515 m/s | 0.565 m/s | 0.585 m/s | 0.645 m/s |
| 30.5 | 59:100 | 0.58 m/s | 0.635 m/s | 0.64 m/s | 0.74 m/s |
| 24.6 | 46:100 | 0.72 m/s | 0.76 m/s | 0.80 m/s | 0.865 m/s |
| 32 | 62.5:100 | 0.41 m/s | 0.60 m/s | 0.52 m/s | 0.60 m/s |
| 27 | 51:100 | 0.43 m/s | 0.73 m/s | 0.58 m/s | 0.73 m/s |
tan(27 degrees) = 0.51 => 51% grade = 51 foot rise per 100 foot run

0.73 m/s horizontal on 27 degree stairs => 0.37 m/s vertical = 1.22 feet/sec vertical
CO2-e emissions
| CO2-e emissions16 | Vehicle type |
|---|---|
| grams per passenger km | |
| 151 | average US car |
| 26 | Nissan Leaf in California |
| 5 | Nissan Leaf in Sweden |
| 67 | New York subway |
| 180 | US urban bus |
Noise
“…the population in Wuhan is 8.3 million, much greater than that in Sheffield, at 0.6 million. … For Wuhan, given that the number of vehicles per person is still much lower than that in Sheffield by tenfold … it is very interesting to note that the average noise levels in all of the sampled areas are lower than those in Sheffield by 2dBA to 11dBA. … In terms of Lmin and L90 … the difference is even greater – for example, up to 15dBA in the area with a motorway.”22 — Jian Kang
Density
| People per square mile |
City | Land area square feet per person |
|---|---|---|
| 85,829 | Central Paris68 | 325 |
| 78,874 | Impossible City Proposal (density of city districts, sans greenbelt) |
353 |
| 71,340 | Manhattan, New York69 | 391 |
| 68,376 | J.H.Crawford’s Carfree Cities Reference Design (density of city districts, sans greenbelt)68 |
408 |
| 52,593 | Paris70 | 530 |
| 27,751 | New York City71 | 1,005 |
| 18,838 | San Francisco72 | 1,480 |
| 10,117 | J.H.Crawford’s Carfree Cities Reference Design (combined density of city districts and greenbelt)68 |
2,756 |
| 10,101 | Suburban single-family housing68 | 2,760 |
| For more examples of city densities, check out DensityAtlas.org. |
Floor area ratio
| FARparcel | FARoverall | Place | |
|---|---|---|---|
| 0.316 | US suburbs | ||
| 0.41 | San Francisco | ||
| ~ | 1.7 | Proposed Impossible City | |
| 3.516 | Historical Paris | ||
| 4 to 1016 | 3 to 773 | Manhattan residential | |
| 1516 | 10 | Manhattan office buildings | |
| 2516 | Singapore highest FAR | ||
| For more FAR examples, check out DensityAtlas.org. |
“urban planners historically focused on residential travel and personal behavior, failing to integrate the movement of goods into their planning.” 74
Source material, chaper 2
Kinematic range
-
In San Francisco, if you are able-bodied and travel by bicycle or public transit, but you do not use a car, then in 30 minutes you can probably get from almost any building in the city to almost any room in any other building in the city. But without a car, there are fairly few places you can get to outside the city limits within 30 minutes. The buildings in San Franicsco have a total of about 540 million square feet of floorspace, and your KR30 might be about 450 million square feet, which is about 50-thousand-fold higher than your range in Haxby.
-
Wurster Hall is a building on the campus of the University of California, Berkeley. It’s a fairly typical mid-rise building, with a normal mix of offices, meeting rooms (classrooms), and open plan work spaces. Most of the floorspace is in the wider base in the first three floors, but there’s a narrower tower that’s ten stories tall. The building has a total of about 225,000 square feet of floorspace, and within 2 minutes you can go between almost any two points in the building, so that’s a 2-minute Kinematic Range, KR2, of 225,000 square feet.
-
On the UC Berkeley campus, traveling by foot, it takes about 25 minutes to walk between two buildings at opposite ends of the main campus. If it takes another 2 minutes to get from the lobby door of a building to a top-floor room, and vice-versa, that means any two rooms on the whole campus are within a 29-minute range. If the campus has about 10 million square feet of floorspace[citation needed], then your KR30 would be about 10 million square feet.
-
In the US Pentagon building, it is possible to walk between any two points in less than seven minutes. The Pentagon has 6.6 million square feet of floorspace, so that’s a KR7 of 6.6 million square feet.75
Kinematic windfall
“Third, the clustering of high-tech inventors brings real benefits to the American economy as a whole. … [Enrico Moretti] estimates that the U.S. would produce about 11 percent fewer patents each year under such a scenario. The country would see a roughly 15 percent annual decline in semiconductor patents, a 13 percent decline in computer science, and a 10 percent decline in biology and chemistry, if the geography of inventors was more equal.”8
Bicycles
We see that bicycles provide a much higher road capacity at speeds below 15 km/h than any other mode of transport.16
Because of their higher speed and increased comfort, electric bicycles, where they are authorized (as in Chengdu, China), could meaningfully compete with buses or cars as a means of commuting in larger cities.16
The emergence of small footprint, on-demand, shared vehicles … will change the way urban transport is organized. The pattern of roads and arterials may also change to adapt to these new modes of urban transport. Instead of concentric traffic on a few high-capacity highways or arterials, numerous smaller low-capacity roads would allow the flexibility required by trips from dispersed origins to dispersed destinations.16
Small cars
By contrast, compared to the motorcycle, compact Smart car performance (except for energy use) in terms of road capacity is not much better than that of an ordinary car. … The width of the vehicle, not its length, is the important parameter to consider when trying to reduce street area consumption.16
Congestion
“In a study last year, Inrix estimated that the cost of congestion in the United States alone was $305 billion (USD)” 10
“In L.A., nothing concerns locals more than traffic—not personal safety, the cost of living, or even the housing market—according to a 2016 poll by the Los Angeles Times. Drivers there spend an average of 80 hours in gridlock every year, according to a report by Texas A&M University.”11
Source material, chaper 3
Affordability
“Above six storeys, significant extra costs are incurred in sprinkler systems, and after ten storeys, the need for enhanced fire escape provision means that the extra costs can only be recouped if storey heights push up above 15 storeys.”13 — Susan Roaf
“For five Melbourne office buildings of the following heights: 3, 7, 15, 42 and 52 storeys, the two high-rise buildings were found to have approximately 60 per cent more energy embodied per unit gross floor area (GFA) in their materials than the low-rise buildings.”13 — Susan Roaf
| Height in stories |
GJ per square meter gross floor area13 |
|---|---|
| 3 | 10.7 |
| 7 | 11.9 |
| 15 | 16.1 |
| 42 | 18.0 |
| 52 | 18.4 |
“In addition, there are higher operation and maintenance costs in taller buildings…”13 — Susan Roaf
Parks & trees
“Meyer-Lindenberg is currently tracking how different parts of the city affect our mental wellbeing, using a technique called ecological momentary assessment, in which participants repeatedly report on the environment around them in real time. Various studies have suggested that nature – be that a tree or a park – has an important impact on people’s mental health.”23
“Studies have consistently linked city living with poorer mental health. For example, growing up in an urban environment is correlated with twice the risk of developing schizophrenia as growing up in the countryside.”23
“Mental health is almost uniformly worse in cities… that’s just what the data shows,” [Andreas] Meyer-Lindenberg says over the phone. “There isn’t really a bright side to this.”23
Resiliency
“Resiliency is the ability to bounce back better, but also the ability to not have to bounce back as much.” — Sylvester Wong, Vice President of AECOM76
“Because its location and design were deliberately chosen to withstand natural calamities, New Clark City will serve as the government’s continuity hub, disaster and risk recovery center – an alternative capital city in case a disaster strikes Manila”76
Source material, chaper 4
Global urban growth
“Half of the urban area that will be needed [by 2050] hasn’t been built yet.”28
“Over the next 40 years, the newly built floor area in the world is expected to double.”77
“We’re going to develop more urban area in the next 100 years than currently exists on Earth”28 — Paul Romer, Nobel prize-winning economist, New York University.
“The amount of floorspace in buildings around the world—currently about 2.5 trillion square feet—is set to double by 2060” — Brian Bienkowski 78
It is estimated that by 2050:
- about 2.5 billion additional people will live in cities (vs. 2019), with 90% of the uptake in Asia and Africa28
- 68% of the world’s population will be living in cities (vs. 55% in 2018)28,57
- about 200 million climate migrants will settle in new locations. (Forecasts vary from 25 million to 1 billion.)79
- 400 million people in India will migrate to cities80
- the African population will double from 1.3 billion today to over 2.5 billion 81
- there will be at least nine African “megacities” of 10 million people or more (and more than two dozen African cities of 5 million or more, about the size of metropolitan Washington), but currently 60 percent of Africa’s city dwellers live in slums 82
- one-third of all of the French Polynesian islands will be submerged83
“This will be by far the largest migration of human beings to have ever taken place on the planet … The resulting challenges to the availability of energy and resources and the enormous stress on the social fabric across the globe are mind-boggling … and the timescales to address them are very short.”7 — Geoffrey West
“The UN estimates that each year cities across the world will gain more than 72 million new residents.”84
“averaged over the next thirty-five years, about a million and a half people will be urbanized each week … the equivalent of another New York metropolitan area [every two months]”7
120 “new cities” are currently being built, in 40 countries.38 These developments are frequently called “new cities”, although often they are more like new suburbs or new satellite neighborhoods of existing cities, rather than brand new cities in their own right.
“China … is on a fast track to build up to three hundred new cities each in excess of a million people over the next twenty to twenty-five years. … At the present rate it will be moving the equivalent of the entire U.S. population (more than 300 million people) to cities in the next twenty to twenty-five years.”7
“India, for example, will be home to 7 cities with populations greater than 10 million residents by 2050.”84
“projections show that Kinshasa, the capital of the Democratic Republic of Congo, will reach 35 million residents by 2050.”84
California urban growth
In California alone, “to satisfy pent-up demand and meet the needs of a growing population, California needs to build 3.5 million homes by 2025.”85
“Broadly speaking, there is no solution to the California housing crisis without the construction of millions of new houses,” said David Garcia, policy director for the Terner Center for Housing Innovation at the University of California, Berkeley.39
“The infrastructure here is really tapped,” Zuckerberg said Thursday. “Housing prices are way up. Traffic is bad.” He added that while Facebook is trying to do what it can to help with what he called the region’s policy challenges, “at this point we’re primarily growing outside of the Bay Area.” … The CEO said he prefers big hubs where Facebook engineering teams could be around one another, and that he doesn’t want to have a lot of small offices around the world, except for where sales teams need to be in the markets they’re serving.86
“58 of the 89 biggest — with headquarters of 100,000 square feet and above — tech and life science companies based in the Bay Area have leased 30.4 million square feet of office space in other U.S. cities since January 2010”86
Refugee migration
“An estimated 2.4 billion people–40% of the world’s population–live in a coastal region and will likely be impacted by rising sea levels as a result of climate change.”83
As of 2018, 70 million people were currently displaced by war, persecution and conflict. Of the total, 51 million were Internally Displaced People (IDPs), and 26 million were refugees (including 13 million refugee children). Most refugees live in towns and cities, not rural areas or refugee camps. Nearly 4 in every 5 refugees are in displacement situations that have lasted for at least five years.87
“Indonesia has already announced a $34 billion plan to move its sinking, flood-prone 30-million-person capital to higher ground”88
“There are billions of people living on coastlines that are going to be flooded. It’s going to be worse and worse and worse year by year and they are going to have to move eventually, and where are they going to move to? … we’re going to have to deal with that on a large scale” — Dr. Tom Goreau, president of the Global Coral Reef Alliance.88
“it has been estimated that it’s going to cost the USA alone around $400 billion over the next two decades in sea level rise damage control”88
Lost opportunities
“The San Francisco metro area [the counties of San Francisco, Alameda, Marin, Contra Costa, and San Mateo] is the third most valuable region in America based on the value of its residential real estate. The area’s total residential real estate value hit an astonishing $1.3 trillion and it’s outranked only by the Los Angeles and New York metro areas, with total residential real estate values of $2.2 trillion and $2.6 trillion, respectively.” … “San Francisco is one of three cities nationwide that can claim a market value higher than Apple Inc.’s $1 trillion.”33
“New city” greenfield developments
More than 120 new cities are currently being built in 40 nations around the world28, and 11,000 new buildings are built every day, meaning 4 million new buildings a year 89. (These developments are frequently called “new cities”, although often they are more like new suburbs or new satellite neighborhoods of existing cities, rather than brand new cities in their own right.)
- Nkwashi, in Zambia, being built by Thebe Investment Management, is expected to house up to 100,000 people.57
- Tatu City, in Kenya, being built by Rendeavour, is planned for 150,000 residents.57
- Forest City, in Malaysia (700,000 residents)
- Enyimba Economic City, in Nigeria (1.5 million residents)
- and more than 100 others…
“Neom is best described as a $500 billion … plan for a 10,000 square mile area”84
“New Cairo, … when completed, it could house as many as 5 million residents”84
“Forest City is a $100 billion new city development which will house 700,000 residents when completed. Forest city is a 5600-acre development.”84
New York land value
“At 305 square miles, New York City makes up only 0.008% of the total land area of the U.S., yet its $1.5tr of housing value is about 5% of the Nation-wide total. Only four states are worth more than New York City, one of which is New York State.”34
“Manhattan‘s housing alone is worth about $733bn, which would make it the 14th most valuable state in the country. Manhattan measures only about 20 square miles, 7.5% of New York City.”34
“What I found most striking of all was the value of some Manhattan neighborhoods. The Upper East Side, which occupies less than one square mile, has an astounding $96bn of housing value. That places it above Staten Island and the Bronx as well as above six states: New Hampshire, North Dakota, South Dakota, Vermont, Wyoming, and Alaska.”34
“The developable land in Manhattan—excluding parks, roads, and highways—was worth between $1.54 and $1.95 trillion, for an average of $1.74 trillion”37
- From 1950 to 2015, the value of Manhattan land grew at an annual rate of 5.5 percent beyond inflation37
Source material, chaper 5
Greenfield development vs. retrofitting
“when planned, built, and governed well, cities can be massive agents of positive change,” … “They can be catalysts for inclusion and powerhouses of equitable economic growth. They can help us protect the environment and limit climate change. That is why we need a new vision for urbanization.” — UN Secretary-General Ban Ki-moon 90
“Our biggest urban problems today—growing inequality, rampant gentrification, housing unaffordability, and increasing segregation—all have roots in the staggering cost of urban land.”37
“Three-quarters of the residential land in Los Angeles is restricted to single-family homes, according to UrbanFootprint, software that helps government and businesses understand cities and urban markets. In San Jose, the figure is 94%.” 39
Projects in existing cities can be staggeringly expensive.
- $4.5 billion for the San Francisco Transbay Transit Center & Salesforce Tower [citation needed]
- $17 billion for the 2nd Avenue Subway project in New York [citation needed]
- $20 billion for the Hudson Yards project in New York [citation needed]
- $21 billion for the Big Dig in Boston [citation needed]
- $23 billion for the Riyadh Metro [citation needed]
- $32 billion to rebuild the World Trade Center in New York [citation needed]
“Retrofitting cities, where cities already exist, can be up to three times more expensive than planning for infrastructure in advance of settlement.” 38
“only about a quarter of New York City’s 472 subway stations are wheelchair accessible” … “subway officials … plan to add elevators at 70 stations in the next five years.” … “The Metropolitan Transportation Authority … estimates that accessibility fixes will cost about $78 million per station.” 15
Construction costs
“the price of construction for an apartment fully equipped with kitchen and bathrooms may cost several thousand US dollars per square meter (about US$2,500 per square meter in New York in 2013 for residential buildings three to seven stories tall).”16
“In the lowest-income countries, where construction is the cheapest, households would need to be able to afford at least US$6,000 for a studio of 12 square meters; US$6,000 is the global market commodity price for the basic construction materials of concrete and steel required to build 12 square meters.”16
“San Francisco has the world’s second-highest construction costs… The city’s average construction costs of $330 per square foot was second only to New York, according to a study last year by Turner and Townsend, a construction consultant. Apartments cost around $425,000 per unit to build.” 41
“New York and San Francisco topped the list of the most expensive construction markets, costing respectively an average of $354 and $330 per square foot to build. Seattle, which faces many of the same labor market and housing supply pressures as San Francisco, came in at $280 per square foot.”42
Funding for new city projects
“Cities generate roughly 80% of global GDP and are home to more than half of the world’s population today, a share that the United Nations projects will reach two-thirds by 2050,” the report said. About 40% of the population lives within 100 kilometers of a coast, and one in 10 people live in areas less than 10 meters above sea level, it said. 35
“The money being thrown at new cities is staggering. Saudi Arabia’s King Abdullah Economic City comes at a price tag of $100bn (£78bn), while the country’s Neom megalopolis is slated to cost five times that. Malaysia’s Forest City had its price initially pegged at $100bn, while Ordos Kangbashi cost a hulking $161bn. Adding up the costs of more than 120 new cities around the world means a mountain of investment that can be measured in the trillions of dollars.”28 — Wade Shepard, author and columnist
“An estimated $100 billion is being invested in new city projects across Africa; [the city of] Diamniadio alone will cost the Senegalese government an estimated $2 billion.”38
“Google pledged $1 billion to help create 15,000 homes in California.”91
“Apple commits $2.5 billion to address California’s housing crisis and homelessness issues”92
“South Sudan’s First Vice-President Taban Deng Gai said the government is working on a master plan for the proposed new capital city of Ramciel that will cost the nation 10 billion US dollars.”93
In 2019, U.S. Presidential candidate Andrew Yang called for $40 billion in subsidies, grants, and loans for people in coastal communities who want to either move inland or elevate their homes.94
Large private-sector projects
In the past, the truly large-scale new developments have all been done by governments, at least up to now. But until recently that was true for space exploration too. Times are changing.
The global banking and investment system is taking on larger private projects now, computers and the internet enable cheaper and faster R&D, recruiting, project management, etc. Global GDP gets bigger every year, and the world takes on new and bigger projects, both public and private.
Perhaps in the coming decades we’ll see increasingly large private-sector real-estate developments. Or, in the public sector, perhaps we’ll see some central planning efforts that are looking for big, cost-effective, high-impact solutions to giant housing shortages.
In recent decades we have begun to see the private sector take on very large scale projects, without government funding.
City Center, in Las Vegas, Nevada, is a good example
- 17 million square feet of mixed use space
- built in 4 years (2006 to 2010)
- 100% privately financed, at a cost of $11 billion [citation needed]
Banks, real estate developers, and the construction industry are now operating at a level where they can coordinate the successful delivery of very large projects.
In the 2020s and 2030s, is will not be crazy to propose a $20 billion privately funded construction project. The project just needs to pencil out well, be low risk, and meet the needs of customers.
Land value capture
There are established public-sector mechanisms for funding development projects, such as Tax Increment Financing (TIF).
“Portland, Oregon, currently dedicates about 40 percent of its TIF revenues to affordable housing. Over nine years, the program generated nearly a quarter of a billion dollars for affordable housing…”59
“The $6 billion Lincoln Yards development in Chicago … stands to receive $1.3 billion in TIF funding”59
“Value capture is a way to generate revenue by recouping a portion of the gains in the value of land that result from improvements of public transportation. … Common value capture mechanisms include:”45 ~ Leasing development rights or selling land. (e.g. Hong Kong) ~ Land Value Tax. ~ Tax Increment Financing (TIF). (e.g. New York)
“To conclude from the above literatures, value capture models are applicable to cities that have a good coordination of land use, city planning and economic development.”45
“Second, it should be able to acquire land at a favorable price, which will minimize the cost and maximize the profit from future land transition.”45
“despite this potential … value capture … doesn’t work in areas that are already developed. … undeveloped area provide the most room for growth.”44
“Hong Kong’s public transit development method, which is well known as a distinctive example of transit value capture. … Hong Kong is one of the few cities in the world where public transport makes a profit.”45
“In terms of land attribute, all land in Hong Kong is state property and the only land tenure is leasehold. The government of Hong Kong is responsible for land management, development, and its lease to private entities, based on China’s Basic Law passed in 1990. Private developers bid to lease land with a general 50 years term.”45
“The state leasehold system captures value from four major aspects: initial land auction, lease modification, lease renewal, and land rent collection. Among the four, initial land auction has been the major source of lease revenue, accounting for about 75 percent of government’s total land income (Hong, 1998).”45
“During the whole process, MTR is functioning as the master planner. It creates a development layout plan, monitors development quality, and manages the lease and sales of completed properties. It is a bridge between the government and developers. It sets clear rules to multiple stakeholders, making the partnership smooth and efficient.”45
“One reason that projects like Tsing Yi Station come into success is that the land use integration is evaluated at the master planning stage by MTR (Tang, Chiang, Baldwin & Yeung, 2004). This magnifies the interaction between railway and property development.”45
“Hong Kong’s strategy can be applied in cities where government owns the land.”45
“Thirdly, the planning of public transportation requires multiple levels of government and agencies to work together. It is important to form a good collaboration between the different development stages, including land acquisition, planning, construction, operation, and property management. In Hong Kong, for example, MTR as a single agency is responsible for the whole development cycle. The process is more efficient, because it saves additional administrative cost, and there is only one principle from beginning to end. For New York, however, as MTA is only responsible for railway construction and operation, and it has no right of land use, the capability of capturing land value is to some extent undermined.”45
“Bartholomew and Ewing’s (2010) study indicates transit accessibility, walkability, and environment quality can be capitalized into real estate prices. The existence of high walkability and mixed land use types are likely to increase land values independent of transit accessibility.”45
“Other factors related to the value generated from public transportation include the service quality, the extent of network, and the ticket price. Andersson (2010) conducted a research about the high speed rail in Taiwan, and finds out that it has little impact on land values due to the high ticket price (A monthly ticket can take up to 70% of the median monthly wage in Taiwan). It is difficult to capitalize expensive services into land values.”45
“Hong Kong is a small island city with an area of 1104 square kilometers. To date, the city has a population of 7.1 million, and is projected to reach 8.6 million by 2026 (HK Census and Statistics Department, 2014).”45
“Zoning regulations allow special FARs in key station areas to attract private investments and comprehensive development.”45
“Corner lots are significantly more valuable than mid-block lots, according to the study, and lots in close proximity to Broadway, which runs the length of the island, also have higher values.”37
Source material, additional
“More recent data, however, reveal substantial urban‐rural fertility gaps (i.e. of one child or more per woman) that tend to be wider at more advanced stages of the fertility transition” 49
“In the full sample of countries, rural fertility is almost 20 percent higher than the urban level on average in the pre‐transitional cohorts. … The ratio increases sharply in the first 20 transition cohorts to 40 percent, stabilizing at this level in the subsequent 10 cohorts. After 30 cohort years have elapsed since the transition onset, the average rural‐urban ratio has dropped monotonically down to 1.23 (in the 55th transition cohort).” 49
“Double the size of a city and on average you’ll find twice as many businesses. The proportionality constant is 21.6, meaning that there is approximately one establishment for about every 22 people in a city, regardless of the city size. Or to put it slightly differently, on average a new workplace is created each time the population of a city increases by just 22 people. … on average, there are only about 8 employees for every establishment, again regardless of the size of city.”7 — Geoffrey West
Congestion pricing
In their 2009 book, aptly title Mobility First, Sam Staley and Adrian Moore describe in detail the cross-disciplinary reforms in road and urban transport design and in road pricing, among other things, that would be required to maintain mobility in cities in the twenty-first century.16
The rent charged should vary with the time of day, the location, the area, and the length of time the road is used. The rent charged for roads should be similar to the fares charged by airlines to passengers or the room rates charged by hotels, except that the rate would not be for a fixed 24 hours but for the number of minutes the roads are actually used.16
Freight
“And New York City, where more than 1.5 million packages are delivered daily…” 3
In New York City, “Delivery trucks operated by UPS and FedEx double-park on streets and block bus and bike lanes. They racked up more than 471,000 parking violations last year, a 34 percent increase from 2013.” 3
“The main entryway for packages into New York City, leading to the George Washington Bridge from New Jersey, has become the most congested interchange in the country. Trucks heading toward the bridge travel at 23 miles per hour, down from 30 m.p.h. five years ago.” 3
“The average number of daily deliveries to households in New York City tripled to more than 1.1 million shipments from 2009 to 2017, the latest year for which data was available, according to the Rensselaer Polytechnic Institute Center of Excellence for Sustainable Urban Freight Systems. … Households now receive more shipments than businesses.” 3
“And it could be just the beginning. Just 10 percent of all retail transactions in the United States during the first quarter of 2019 were made online, up from 4 percent a decade ago, according to the Census Bureau.” 3
“About 15 percent of New York City households receive a package every day, according to the Sustainable Urban Freight Systems center at Rensselaer.” 3
Notes
TODO: include on this web page some animated images of traffic simulations for the Impossible City design, maybe somewhat like the SUMO simulation output images on this page: sidewalk-talk
References
-
“Manhattan Speed Limits”. NYC Department of Transportation. ↩
-
“New York City Mobility Report”, June 2018. NYC Department of Transportation. ↩ ↩2
-
“1.5 Million Packages a Day: The Internet Brings Chaos to N.Y. Streets”. Matthew Haag and Winnie Hu, New York Times. 27 Oct 2019. ↩ ↩2 ↩3 ↩4 ↩5 ↩6 ↩7 ↩8
-
“I’ve Seen a Future Without Cars, and It’s Amazing”. Farhad Manjoo, New York Times. 9 July 2020. ↩ ↩2
-
“6 month report: My e-bike ate my car”. Lloyd Alter, TreeHugger. 1 November 2019. ↩
-
“The growing distance between people and jobs in metropolitan America”. Elizabeth Kneebone and Natalie Holmes, Metropolitan Policy Program at Brookings. July 2016. ↩ ↩2
-
Scale, by Geoffrey West. 2018. ↩ ↩2 ↩3 ↩4 ↩5 ↩6 ↩7 ↩8 ↩9 ↩10
-
“Why U.S. Tech Inventors Are So Highly Clustered”. Richard Florida, CityLab. 1 October 2019. ↩ ↩2 ↩3
-
“Living Together, Happier Together”. Sébastien Turbot, NewCities. 20 March 2019. ↩ ↩2
-
“Navigation Apps Changed the Politics of Traffic”. Laura Bliss, City Lab. 12 November 2019. ↩ ↩2
-
“Parking Structure Cost Outlook for 2017”. Gary Cudney, Carl Walker. ↩
-
“The Sustainability of High Density”, by Susan Roaf, Chapter 3 of “Designing High-Density Cities”, edited by Edward Ng. ↩ ↩2 ↩3 ↩4 ↩5 ↩6
-
“Making apartments more affordable starts with understanding the costs of building them”. Hannah Hoyt and Jenny Schuetz, Brookings.edu. 5 May 2020 ↩ ↩2
-
“M.T.A. Pledges $5 Billion for Subway Elevators. Guess How Many.”. Emma G. Fitzsimmons & Rebecca Liebson, New York Times. 7 October 2019. ↩ ↩2
-
Order without Design: How Markets Shape Cities, by Alain Bertaud ↩ ↩2 ↩3 ↩4 ↩5 ↩6 ↩7 ↩8 ↩9 ↩10 ↩11 ↩12 ↩13 ↩14 ↩15 ↩16 ↩17 ↩18 ↩19 ↩20 ↩21 ↩22
-
“Even though women comprise nearly half of the population, it is surprising they account for less than one in five trips made in Indian cities.” “Delhi Will Improve When Women Get to Move”. Shreya Gadepalli, NewCities. 8 March 2019. ↩
-
“Cities Foster Equity by Improving Urban Mobility for Women”. Hannah McCasland, NewCities. 8 March 2019. ↩
-
“Evidence from Argentina shows that on average men and women’s commute time is roughly the same, but women travel at slower speeds and cover shorter distances.” “Transport is Not Gender Neutral” Karla Dominguez Gonzalez, NewCities. 8 March 2019. ↩
-
“Sex and cycling: How bike craze aroused passions in 1890s San Francisco”. Gary Kamiya, San Francisco Chronicle. 18 Oct 2019. ↩
-
“The Hyperloop and the Self-Driving Car Are Not the Future of Transportation”. Henry Grabar, Slate.com. 30 Oct 2019. ↩
-
“Sound Environment: High- versus Low-Density Cities”, by Jian Kang, Chapter 12 of “Designing High-Density Cities”, edited by Edward Ng ↩ ↩2 ↩3
-
“Urban living makes us miserable. This city is trying to change that”. Fleur Macdonald, Mosaic. 15 October 2019. ↩ ↩2 ↩3 ↩4
-
“HELPING TO SAVE LIVES THROUGH PROVEN INTERVENTIONS THAT REDUCE ROAD TRAFFIC FATALITIES”. Bloomberg Philanthropies ↩
-
“21 Solutions to Road Deaths”. David Levinson, Transportist. 2 Oct 2019. ↩ ↩2
-
“We ran traffic simulations on our people-first street designs. Here’s what we found”. Willa Ng, Sidewalk Labs. 9 September 2019. ↩
-
Environmental Insights Explorer. Google. 2018. ↩
-
“Should we build cities from scratch?”. The Guardian. 10 July 2019. ↩ ↩2 ↩3 ↩4 ↩5 ↩6 ↩7 ↩8 ↩9
-
“68% of the world population projected to live in urban areas by 2050, says UN”. United Nations, Department of Economic and Social Affairs. 16 May 2018. ↩
-
“GCIF Working Paper No. 4: Population predictions of the 101 largest cities in the 21st century.”. Hoornweg & Pope. ↩ ↩2 ↩3
-
“Urban world: Mapping the economic power of cities”. McKinsey Global Institute, McKinsey & Company. March 2011. ↩ ↩2
-
“Key Facts”. French American Chamber of Commerce. ↩
-
“What’s worth more: All of San Francisco’s residential real estate or Apple Inc.?”. Emily Hoeven, San Francisco Business Times. 29 August 2018. ↩ ↩2
-
“A Striking Perspective on New York City Property Values”. Metrocosm. 24 June 2015. ↩ ↩2 ↩3 ↩4
-
“Goldman Sachs released a 34-page analysis of the effects of climate change. And the results are terrifying.”. Yusuf Khan, Markets Insider. 25 September 2019. ↩ ↩2
-
“8 things to know about gloval real estate value”. Savills Impacts. July 2018. ↩
-
“What’s Manhattan’s Land Worth? Try ‘Canada’s Entire GDP’”. Richard Florida, CityLab. 24 April 2018. ↩ ↩2 ↩3 ↩4 ↩5 ↩6
-
“African countries keep building new cities to meet rapid urbanization even if people won’t live in them”. Astrid R.N. Haas, International Growth Centre. 31 October 2019. ↩ ↩2 ↩3 ↩4
-
“How California Became America’s Housing Market Nightmare”. Noah Buhayar and Christopher Cannon, Bloomberg. 6 November 2019 ↩ ↩2 ↩3
-
“The Future of Greenfield Cities”. NewCities. 23 July 2019. ↩
-
“Why San Francisco has the second-highest construction costs in the world”. Roland Li, San Francisco Business Times. 24 Jan 2018 ↩ ↩2
-
“Perspectives: Practitioners Weigh in on Drivers of Rising Housing Construction Costs in San Francisco”. Carolina Reid and Hayley Raetz, Terner Center for Housing Innovation. January 2018. ↩ ↩2
-
“CityCenter”. Wikipedia. ↩
-
“Why more big cities should give value capture a chance”. Eric Jaffe, Sidewalk Talk. 6 March, 2020. ↩ ↩2 ↩3 ↩4
-
“Under What Circumstances Will Land Value Capture Work to Finance Public Transit?”. Yidan Xu, Columbia University Libraries, Academic Commons. May 2015. ↩ ↩2 ↩3 ↩4 ↩5 ↩6 ↩7 ↩8 ↩9 ↩10 ↩11 ↩12 ↩13 ↩14 ↩15 ↩16 ↩17 ↩18 ↩19 ↩20 ↩21 ↩22 ↩23
-
“Depreciating licenses”. E. Glen Weyl & Anthony Lee Zhang. 24 January 2018. ↩
-
“Induced demand”. Wikipedia. ↩ ↩2
-
“Fertility Decline in Urban and Rural Areas of Developing Countries”. Mathias Lerch. 19 December 2018. ↩ ↩2 ↩3
-
“CityLab University: Shared-Equity Homeownership”. Benjamin Schneider, CityLab. 29 April 2019. ↩ ↩2
-
“Global Compact for Migration”. Wikipedia. ↩
-
“Isochrone map”. Wikipedia. ↩
-
“Jevons paradox”. Wikipedia. ↩
-
“Habitat III: New Urban Agenda”. Wikipedia. ↩
-
“The Law and Policy of Refugee Cities: Special Economic Zones for Migrants”. Michael Castle-Miller, Politas Consulting. July 2018. ↩
-
“Special economic zone”. Wikipedia. ↩
-
“The Case for Charter Cities Within the Effective Altruist Framework”. Jeffrey Mason, Charter Cities Institute. Sept 2019. ↩ ↩2 ↩3 ↩4
-
“Sustainable Development Zones”. July 2018. ↩
-
“CityLab University: Tax Increment Financing”. Benjamin Schneider, CityLab. 24 Oct 2019. ↩ ↩2 ↩3
-
“Projections of population growth”. Wikipedia. ↩ ↩2
-
“Ex-Uber exec launches startup to autonomously reposition electric scooters and bikes”. Megan Rose Dickey, TechCrunch. 15 October 2019. ↩
-
“Outside the box truck: Innovations in delivery that could change our cities”. Vanessa Quirk, Sidewalk Talk. 13 Sept 2018. ↩
-
“Global Street Design Guide”. National Association of City Transportation Officials (NACTO). ↩
-
“Blueprint for Autonomous Urbanism”, Second Edition. National Association of City Transportation Officials (NACTO). ↩
-
“The influence of surface slope on human gait characteristics: a study of urban pedestrians walking on an inclined surface”. JIE SUN, MEGAN WALTERS, NOEL SVENSSON & DAVID LLOYD, Ergonomics Volume 39, 1996 - Issue 4 ↩
-
“An Explicit Study on Walking Speeds of Pedestrians on Stairs”, Taku Fujiyama and Nick Tyler, University College London. ↩
-
Carfree Cities, by J.H. Crawford ↩ ↩2 ↩3 ↩4
-
“Manhattan”. Wikipedia. ↩
-
“New York City”. Wikipedia. ↩
-
“San Francisco”. Wikipedia. ↩
-
“Manhattan, Grand Street Neighborhood”. Density Atlas. ↩
-
“How the Urban Freight Lab seeks to fix the last 50 feet of shipping”. Elsa Wenzel, GreenBiz Group. 15 October 2019. ↩
-
“The Pentagon”. Wikipedia. ↩
-
“Resilient Growth: Building a Resilient City in the Philippines”. NewCities. 2019. ↩ ↩2
-
“Concrete: the most destructive material on Earth”. Jonathan Watts, The Guardian. 25 Feb 2019 ↩
-
“We’re building the equivalent of Paris every week. That’s a problem.”. Brian Bienkowski, The Daily Climate. 11 Dec 2017. ↩
-
“Migration, Environment and Climate Change: Assessing the Evidence”. (PDF) International Organization for Migration. 2009. ↩
-
“Greenfield Smart Cities Shaping the Future of India”. NewCities. 23 July 2019. ↩
-
“The Power Of Purpose: Unlocking Africa’s $10 Trillion Opportunity In Housing”. Forbes. 12 September 2019. ↩
-
“Africa’s Cities Are About to Boom – and Maybe Explode”. Bloomberg. 25 July 2019. ↩
-
“Floating cities once seemed like sci-fi. Now the UN is getting on board”. Fast Company. 4 April 2019. ↩ ↩2
-
“Exponents Magazine: A Beginner’s Guide to Building New Cities”. Dr. Mark Lutter, Charter Cities Institute. 9 October 2019. ↩ ↩2 ↩3 ↩4 ↩5 ↩6
-
“A Tool Kit to Close California’s Housing Gap: 3.5 Million Homes by 2025”. McKinsey & Company. October 2016 ↩
-
“Bay Area housing, traffic have Facebook looking elsewhere for expansion”. Levi Sumagaysay, Bay Area News Group. 4 October 2019. ↩ ↩2
-
“Worldwide displacement tops 70 million, UN Refugee Chief urges greater solidarity in response”. UNHCR: The UN Refugee Agency. 19 June 2019. ↩
-
“Waterworld? Floating Cities Turn Hollywood Sci-fi Into Reality As Sea Levels Rise”. Wade Shepard, Forbes. 23 Oct 2019. ↩ ↩2 ↩3
-
“urbAIn – AI, Cities, and Climate Change”. Metabuild.io. 15 June 2019. ↩
-
“Slumscapes: How the world’s five biggest slums are shaping their futures”. Paola Totaro, Reuters. 17 October 2016. ↩
-
“Affordable Housing”. Prashant Gopal and Rob Urban, Bloomberg. 21 Oct 2019. ↩
-
“Apple commits $2.5 billion to address California’s housing crisis and homelessness issues”. Sarah Perez, TechCrunch. 4 November 2019. ↩
-
“Proposed Ramciel city master plan to cost 10 billion USD”. Radio Tamazuj. 30 October 2019. ↩
-
“Andrew Yang’s plan to tackle climate change, explained”. Vox.com. 26 August 2019. ↩